. 2012 Aug;22(8):1799-812.
doi: 10.1093/cercor/bhr258. Epub 2011 Sep 22.

Androgen influence on prefrontal dopamine systems in adult male rats: localization of cognate intracellular receptors in medial prefrontal projections to the ventral tegmental area and effects of gonadectomy and hormone replacement on glutamate-stimulated extracellular dopamine level

Affiliations

Androgen influence on prefrontal dopamine systems in adult male rats: localization of cognate intracellular receptors in medial prefrontal projections to the ventral tegmental area and effects of gonadectomy and hormone replacement on glutamate-stimulated extracellular dopamine level

T Aubele et al. Cereb Cortex. 2012 Aug.

Abstract

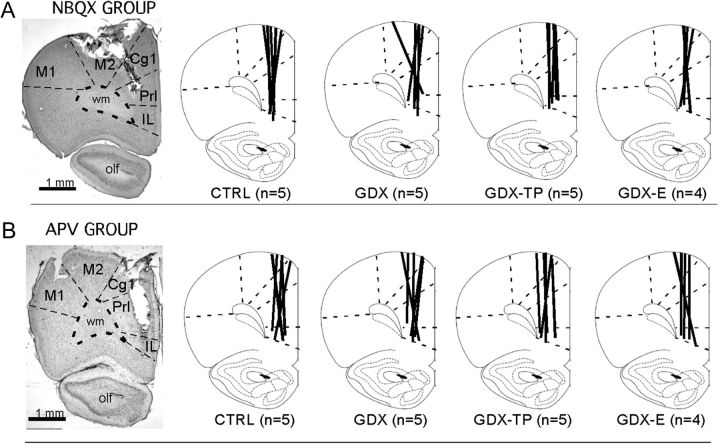
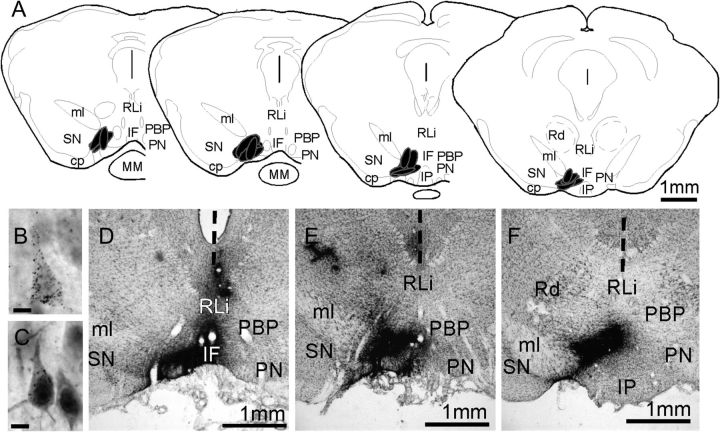
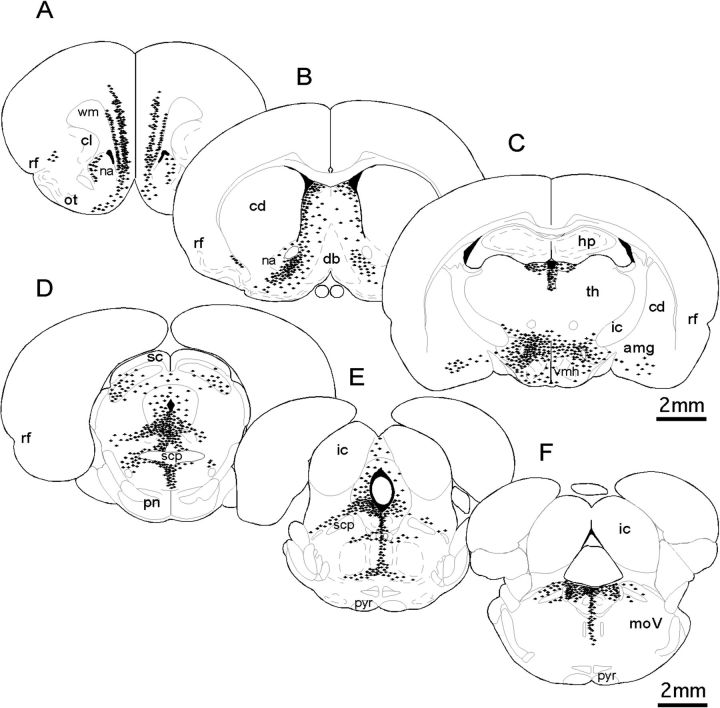
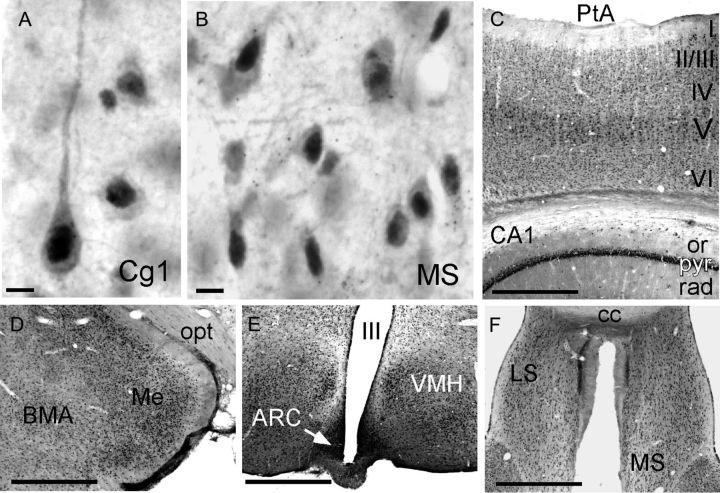
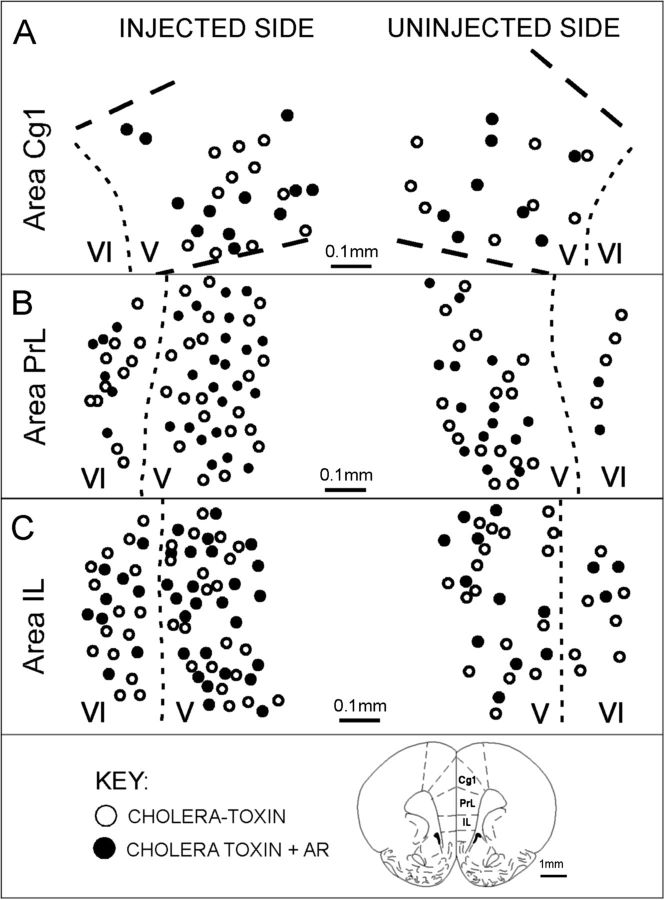
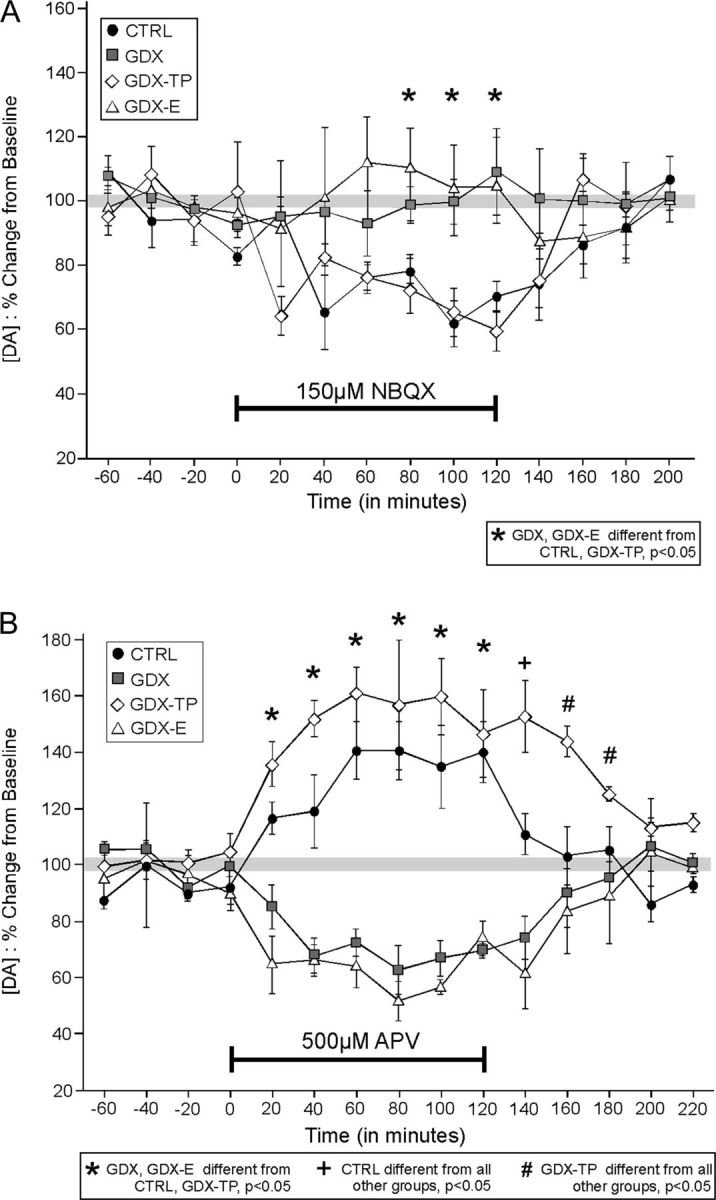
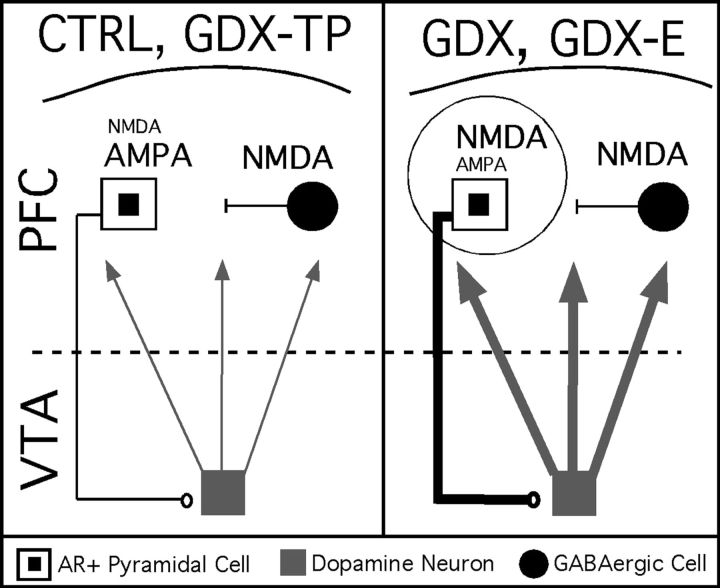
Although androgens are known to modulate dopamine (DA) systems and DA-dependent behaviors of the male prefrontal cortex (PFC), how this occurs remains unclear. Because relatively few ventral tegmental area (VTA) mesoprefrontal DA neurons contain intracellular androgen receptors (ARs), studies presented here combined retrograde tracing and immunolabeling for AR in male rats to determine whether projections afferent to the VTA might be more AR enriched. Results revealed PFC-to-VTA projections to be substantially AR enriched. Because these projections modulate VTA DA cell firing and PFC DA levels, influence over this pathway could be means whereby androgens modulate PFC DA. To assess the hormone sensitivity of glutamate stimulation of PFC DA tone, additional studies utilized microdialysis/reverse dialysis application of α-amino-3-hydroxy-5-methyl-4-isoxazolepropionic acid and N-methyl-D-aspartate receptor subtype-selective antagonists which act locally within the PFC and tegmentally via inhibition or disinhibition of PFC-to-VTA afferents to modulate intracortical DA levels. Here, we compared the effects of these drug challenges in control, gonadectomized, and gonadectomized rats given testosterone or estradiol. This revealed complex effects of gonadectomy on antagonist-stimulated PFC DA levels that together with the anatomical data above suggest that androgen stimulation of PFC DA systems does engage glutamatergic circuitry and perhaps that of the AR-enriched glutamatergic projections from PFC-to-VTA specifically.


Figures

Figure 1.
Figure 1.
Representative low-power photomicrographs showing the track of a microdialysis probe in cresyl violet counterstained sections of the mPFC of control animals from the NBQX (A) and the APV (B) studies. The boundaries between cytoarchitectonic areas and between cortex and white matter are marked with dashed lines. Line drawings (modified from Paxinos and Watson 1998) to the right depict the locations of microdialysis probe tracks (thick black lines) for each sham-operated control (CTRL), gonadectomized (GDX), and gonadectomized rats supplemented with testosterone propionate (GDX-TP) or 17-β-estradiol (GDX-E) used in the NBQX (A) or APV (B) study. The numbers that appear in parentheses below the drawings correspond to the number of animal subjects in that group. Abbreviations: Cg1, anterior cingulate cortex; IL, infralimbic cortex M1, primary motor cortex; M2, premotor cortex; olf, olfactory nuclei and tract; PrL, prelimbic cortex.
Figure 2.
Figure 2.
(A) Schematic maps showing the locations of VTA injection sites from the 5 animal subjects used in this study. The section outlines shown are adapted from the atlas of Paxinos and Watson (1998) and the locations of injection sites are shown in black. Low-power photomicrographs (DF) show that injection sites appear in situ as dense, blackened areas; these were localized with respect ventral midbrain cytoarchitecture in 1 in 3 series of 40 μm cresyl violet stained sections (DF). The vertical dashed line in these images marks the midline. High-power photomicrographs (B,C) show the appearance of representative neurons that are retrogradely labeled by the gold-conjugated cholera toxin injections. The cytoplasm of both pyramidal cells contains above background levels of silver-enhanced gold particles; the retrogradely labeled cell shown in C also shows nuclear localization of immunoreactivity for intracellular AR and is situated next to a cell that is immunoreactive for AR but that is not retrogradely labeled. Abbreviations: cp, cerebral peduncle; IF, interfascicular nucleus; IP, interpeduncular nucleus; ml, medial lemniscus; MM, mammillary nucleus; PBP, parabrachial VTA; PN, paranigral VTA; Rd, red nucleus; RLi, rostrolinear nucleus; SN, substantianigra. Scale bars in B,C = 10 microns.
Figure 3.
Figure 3.
Schematic diagrams derived from camera lucida drawings representing the distribution and relative density of neurons (black symbols) retrogradely labeled by cholera toxin injections localized to the VTA rostral (AC) and caudal (DF) to the injection site level. Each black symbol shown represents 3–5 back-labeled cells; section outlines are adapted from Paxinos and Watson (1998). Similar to what has been described previously, cells that project to the VTA are located bilaterally and tend to be clustered among structures that are ventral and lateral to the midline from the level of the pregenual PFC (A) to midmedulla (F). Labeling is also noticeably more dense in hemispheres ipsilateral to injection sites (left-hand side). Abbreviations: amg, amygdala; cd, caudate nucleus; cl, claustrum; db, diagonal band; ic, inferior colliculus; hp, hippocampus; internal capsule; moV, motor trigeminal nucleus; nucleus accumbens; ot, olfactory tubercle; pn, pontine nuclei; pyr, pyramidal tract; rf, rhinal fissure; sc, superior colliculus; scp, superior cerebellar peduncle; th, thalamus; vhm, ventromedial hypothalamus.
Figure 4.
Figure 4.
(A,B) High-power photomicrographs showing the cellular distribution of immunoreactivity for intracellular AR. The dense nuclear and lighter cytoplasmic signal that identify immunopositive cells can be seen in representative pyramidal cells from anterior cingulate (Cg1) cortex (A) and multipolar cells from the medial septal nucleus (MS, B). (CF). Lower power photomicrographs illustrate expected patterns of AR-immunoreactive cells, visible as small black dots, which are especially dense in the pyramidal cell layers of cerebral (II/III, V, VI) and hippocampal cortex (pyr, C), within the medial nucleus of the amygdala (Me, D), the arcuate (ACR), and ventromedial hypothalamic nuclei (VMH, E), and in the medial (MS) and lateral (LS) septal areas (F). Other abbreviations: BMA, basomedial nucleus of the amygdala; cc, corpus callosum; op, optic tract; or, stratum oriens; PtA, parietal cortex; rad, stratum radiatum; III, third ventricle. Scale bars A,B = 20 microns; scale bars CF = 1 mm.
Figure 5.
Figure 5.
(A) Representative camera lucida drawings replotted onto section outlines adapted from Paxinos and Watson (1998), showing the location of medial prefrontal cortical neurons that were retrogradely labeled by cholera toxin injection in the VTA (open circles) and of neurons that were both retrogradely labeled and immunoreactive for AR (black circles). Labeling within areas Cg1, PrL, and IL from hemispheres ipsilateral (injected, left-hand side) and contralateral (uninjected, right-hand side) to the injection site is shown; laminar boundaries are marked by dashed lines and layers are identified by Roman numerals. Back-labeled cells were all confined to layers V and VI. From one-third to more than half of these cells were immunoreactive for AR.
Figure 6.
Figure 6.
(A) Timelines showing the effect of reverse dialysis application of NBQX (A) and of APV (B) on PFC extracellular DA levels expressed as mean percent change from baseline (±standard error of the mean) in control (CTRL, black circles), gonadectomized (GDX, gray squares), and GDX rats supplemented with testosterone propionate (GDX-TP, white diamonds) or with estradiol (GDX-E, white triangles). Within 20 min of application, NBQX decreased extracellular DA levels in CTRL and GDX-TP rats B but had no measureable effect on DA levels in the GDX or GDX-E groups (A). The reverse dialysis application of APV on the other hand increased prefrontal DA levels in the CTRL and GDX-TP groups but decreased DA levels in GDX and GDX-E rats. Asterisks identify all time points during the studies when drug effects on DA levels in GDX and GDX-E animals are significantly different than that in CTRL and GDX-TP groups. A plus sign (+) indicates the time point when DA levels in CTRL rats were significantly different from all other groups and pound signs (#) indicate times when DA levels in GDX-TP rats were significantly different from all other groups.
Figure 7.
Figure 7.
Circuit diagram of a working model for androgen influence over mesoprefrontal DA levels. This study showed that pyramidal cells projecting from PFC to the VTA contain intracellular ARs (white squares with black centers). The output of these pyramids is well known to provide a tonic excitatory drive onto mesoprefrontally projecting DA neurons (gray square) that is normally a balance of direct AMPA-mediated excitation and disynaptic inhibition resulting from NMDA-mediated excitation of local GABAergic interneurons (black circle). In this working model, androgen is critical in maintaining the AMPA sensitivity and a relative NMDA insensitivity of these AR-bearing corticofugal pyramids. Thus, in control animals (CTRL) and in gondadectomized rats supplemented with testosterone (GDX-TP) where androgen influence is preserved, AMPA antagonism decreases and NMDA antagonism increases activity in these pyramidal cells, in midbrain DA cells and ultimately in PFC DA levels, and normal resting PFC DA levels are observed (left panel). However, in gonadectomized rats (GDX) and in gonadectomized rats given estradiol (GDX-E, right panel) where androgen influence is diminished, there results an aberrant increase in sensitivity to NMDA-mediated stimulation and a decrease in the sensitivity to AMPA-mediated stimulation within this pathway. This is consistent with the reduced effect of AMPA antagonism and can also explain the highly abnormal decreases in PFC DA level that NMDA antagonism produces in GDX and GDX-E animals. The hyperexcitability that an increase in the ratio of NMDA-to-AMPA transmission is also likely to yield (thicker pyramidal cell axon, right panel) would also result in increased basal stimulation of the VTA and thus account for the increased DA overflow at rest (thicker DA cell axons) that is also observed in GDX and GDX-E rats.

References

    1. Adler A, Vescovo P, Robinson JK, Kritzer MF. Gonadectomy in adult life increases tyrosine hydroxylase immunoreactivity in the prefrontal cortex and decreases open field activity in male rats. Neuroscience. 1999;89:939–954. - PubMed
    1. Akhondzadeh S, Rezaei F, Larijani B, Nejatisafa AA, Kashani L, Abbasi SH. Correlation between testosterone, gonadotropins and prolactin and severity of negative symptoms in male patients with chronic schizophrenia. Schizophr Res. 2006;84:405–410. - PubMed
    1. Arnsten AF. Toward a new understanding of attention-deficit hyperactivity disorder pathophysiology: an important role for prefrontal cortex dysfunction. CNS Drugs. 2009;23(Suppl 1):33–41. - PubMed
    1. Aubele T, Kaufman R, Montalmant F, Kritzer MF. Effects of gonadectomy and hormone replacement on a spontaneous novel object recognition task in adult male rats. Horm Behav. 2008;54:244–252. - PMC - PubMed
    1. Aubele T, Kritzer MF. Gonadectomy and hormone replacement affects in vivo Basal extracellular dopamine levels in the prefrontal cortex but not motor cortex of adult male rats. Cereb Cortex. 2011;21:222–232. - PMC - PubMed

Publication types