. 2011 Oct;60(10):2506-14.
doi: 10.2337/db11-0083. Epub 2011 Sep 22.

Inhibition of Id1 augments insulin secretion and protects against high-fat diet-induced glucose intolerance

Affiliations

Inhibition of Id1 augments insulin secretion and protects against high-fat diet-induced glucose intolerance

Mia C Akerfeldt et al. Diabetes. 2011 Oct.

Abstract

Objective: The molecular mechanisms responsible for pancreatic β-cell dysfunction in type 2 diabetes remain unresolved. Increased expression of the helix-loop-helix protein Id1 has been found in islets of diabetic mice and in vitro models of β-cell dysfunction. Here, we investigated the role of Id1 in insulin secretion and glucose homeostasis.

Research design and methods: Id1 knockout (Id1(-/-)) and wild-type mice were fed a chow or high-fat diet. Glucose tolerance, insulin tolerance, β-cell mass, insulin secretion, and islet gene expression were assessed. Small interfering RNA (siRNA) was used to silence Id1 in MIN6 cells, and responses to chronic palmitate treatment were assessed.

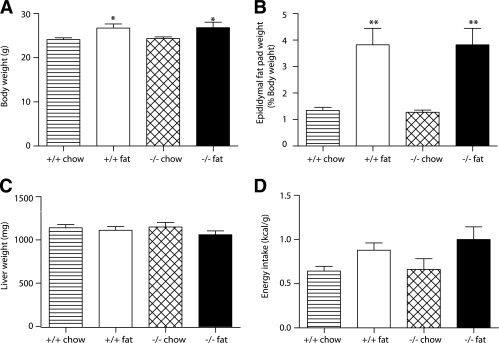
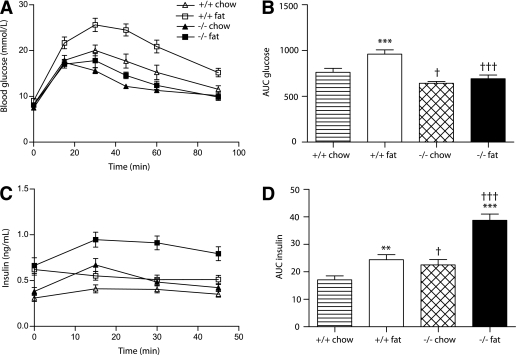
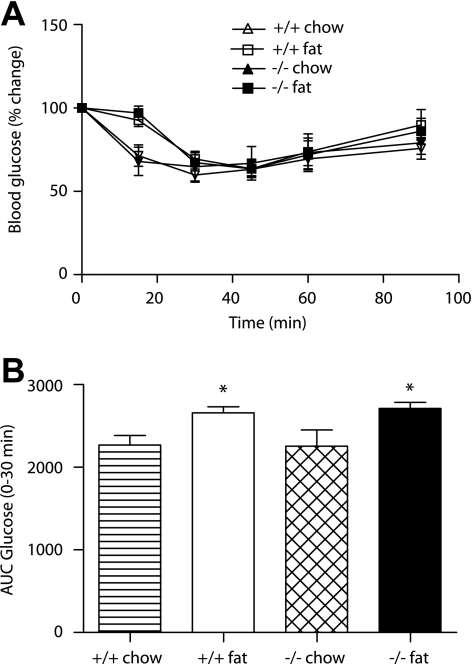
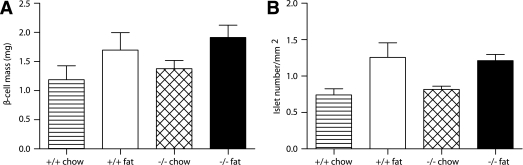
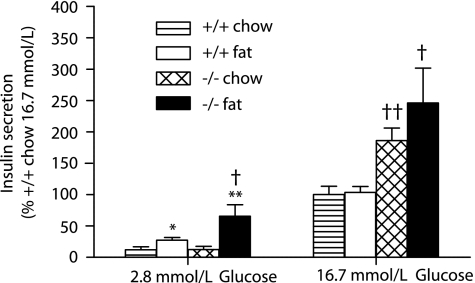
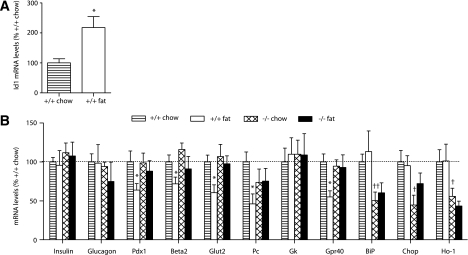
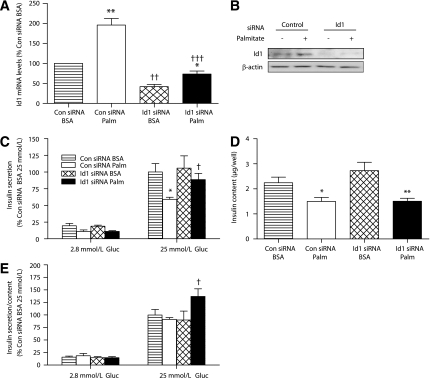
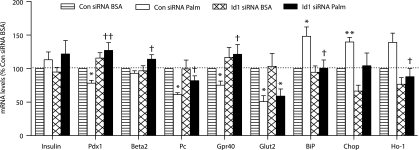
Results: Id1(-/-) mice exhibited an improved response to glucose challenge and were almost completely protected against glucose intolerance induced by high-fat diet. This was associated with increased insulin levels and enhanced insulin release from isolated islets, whereas energy intake, body weight, fat pad weight, β-cell mass, and insulin action were unchanged. Islets from Id1(-/-) mice displayed reduced stress gene expression and were protected against high-fat diet-induced downregulation of β-cell gene expression (pancreatic duodenal homeobox-1, Beta2, Glut2, pyruvate carboxylase, and Gpr40). In MIN6 cells, siRNA-mediated inhibition of Id1 enhanced insulin secretion after chronic palmitate treatment and protected against palmitate-mediated loss of β-cell gene expression.

Conclusions: These findings implicate Id1 as a negative regulator of insulin secretion. Id1 expression plays an essential role in the etiology of glucose intolerance, insulin secretory dysfunction, and β-cell dedifferentiation under conditions of increased lipid supply.


Figures

FIG. 1.
FIG. 1.
Metabolic parameters of Id1−/− and wild-type mice fed a standard chow diet (hatched bars and striped bars, respectively) or a high-fat diet (black bars and white bars, respectively) for 6 weeks. A: Body weight for wild-type (n = 22) and Id1−/− (n = 22) mice fed a chow diet and wild-type (n = 16) and Id1−/− (n = 11) mice fed a high-fat diet. *P < 0.05 for effect of diet in wild-type and Id1−/− mice. B: Epididymal fat pad weight. Results are expressed as a percentage of body weight for wild-type (n = 5) and Id1−/− (n = 6) mice fed a chow diet and wild-type (n = 7) and Id1−/− (n = 7) mice fed a high-fat diet. **P < 0.01 for effect of diet in wild-type and Id1−/− mice. C: Liver weight for wild-type (n = 10) and Id1−/− (n = 6) mice fed a chow diet and wild-type (n = 8) and Id1−/− (n = 6) mice fed a high-fat diet. D: Energy intake of wild-type (n = 9) and Id1−/− (n = 6) mice fed a chow diet and wild-type (n = 12) and Id1−/− (n = 8) mice fed a high-fat diet. ANOVA: P < 0.05 for effect of diet.
FIG. 2.
FIG. 2.
Effect of Id1 deletion on glucose tolerance and insulin levels in wild-type and Id1−/− mice fed a standard chow diet (white triangles/striped bars and black triangles/hatched bars, respectively) or a high-fat diet (white squares/white bars and black squares/black bars, respectively) for 6 weeks. A: Blood glucose levels during an intraperitoneal GTT of wild-type (n = 19) and Id1−/− (n = 22) mice fed a chow diet and wild-type (n = 12) and Id1−/− (n = 6) mice fed a high-fat diet. ANOVA: P < 0.0001 for effect of diet in wild-type mice, P < 0.05 for effect of diet in Id1−/− mice, P < 0.0001 for effect of Id1 deletion in chow-fed mice, and P < 0.0001 for effect of Id1 deletion in fat-fed mice. B: AUC of blood glucose levels during the intraperitoneal GTT. ***P < 0.001 for effect of fat diet in wild-type mice, †P < 0.05 for effect of Id1 deletion in chow-fed mice, and †††P < 0.001 for effect of Id1 deletion in fat-fed mice. C: Insulin levels during intraperitoneal GTT of wild-type (n = 14) and Id1−/− (n = 17) mice fed a chow diet and wild-type (n = 11) and Id1−/− (n = 6) mice fed a high-fat diet. ANOVA: P < 0.01 for effect of fat diet in wild-type mice, P < 0.0001 for effect of fat diet in Id1−/− mice, P < 0.05 for effect of Id1 deletion in chow-fed mice, and P < 0.001 for effect of Id1 deletion in fat-fed mice. D: AUC of insulin levels during intraperitoneal GTT. **P < 0.01 for effect of fat diet in wild-type mice, †P < 0.05 for effect of Id1 deletion in chow-fed mice, ***P < 0.001 for effect of fat diet in Id1−/− mice, and †††P < 0.001 for effect of Id1 deletion in fat-fed mice.
FIG. 3.
FIG. 3.
Effect of Id1 deletion on insulin action in wild-type and Id1−/− mice fed a chow diet (white triangle/striped bar and black triangle/hatched bar, respectively) or a high-fat diet (white square/white bar and black square/black bar, respectively). A: Blood glucose levels during an intraperitoneal ITT of wild-type (n = 5) and Id1−/− (n = 4) mice fed a chow diet and wild-type (n = 8) and Id1−/− (n = 6) mice fed a high-fat diet. ANOVA: P < 0.05 for effect of fat diet in wild-type and Id1−/− mice. B: AUC 0–30 min of blood glucose levels during intraperitoneal ITT. *P < 0.05 for effect of diet in wild-type and Id1−/− mice.
FIG. 4.
FIG. 4.
Comparison of β-cell mass and islet number in wild-type and Id1−/− mice fed either a chow (striped bars and hatched bars, respectively) or a high-fat (white bars and black bars, respectively) diet. A: β-Cell mass of wild-type (n = 3) and Id1−/− (n = 4) mice fed a chow diet and wild-type (n = 4) and Id1−/− (n = 5) mice fed a high-fat diet. ANOVA: P < 0.05 for effect of fat diet in wild-type and Id1−/− mice. B: Number of islets per area of pancreas. ANOVA: P < 0.01 for effect of fat diet in wild-type and Id1−/− mice.
FIG. 5.
FIG. 5.
Effects of Id1 deletion on GSIS ex vivo in isolated islets. Batches of islets isolated from wild-type mice fed a chow (striped bar, n = 6) or a high-fat (white bar, n = 7) diet and Id1−/− mice fed a chow (hatched bar, n = 7) or a high-fat (black bar, n = 5) diet were incubated at low (2.8 mmol/L) or high glucose (16.7 mmol/L) for 1 h. Insulin was measured in an aliquot of the media by radioimmunoassay. *P < 0.05 for effect of fat diet in wild-type mouse islets at low glucose, **P < 0.01 for effect of fat diet in Id1−/− mouse islets at low glucose, †P < 0.05 for effect of genotype in fat-fed mouse islets at low and high glucose, and ††P < 0.01 for effect of genotype in chow-fed mouse islets at high glucose.
FIG. 6.
FIG. 6.
Relative gene expression levels in islets. Islets were isolated from wild-type and Id1−/− mice fed a chow (striped bars and hatched bars, respectively) or a high-fat (white bars and black bars, respectively) diet. Total RNA was extracted, reverse transcribed, and analyzed by real-time PCR. A: Expression of Id1 in islets of wild-type mice fed a chow (n = 5) or a high-fat (n = 6) diet. *P < 0.05 for effect of fat diet. B: Expression of the genes indicated in wild-type mice fed a chow (n = 5–6) or a high-fat (n = 5–7) diet and Id1−/− mice fed a chow (n = 5–7) or a high-fat (n = 4–7) diet. *P < 0.05 for effect of fat diet in wild-type mice, †P < 0.05, and ††P < 0.01 for effect of genotype in chow-fed mice.
FIG. 7.
FIG. 7.
siRNA-mediated silencing of Id1 in MIN6 cells increases insulin secretion after chronic palmitate exposure. MIN6 cells transfected with Id1 ON-TARGETplus SMARTpool siRNA or control Non-Targeting siRNA were pretreated with either 0.92% BSA alone or 0.92% BSA coupled to 0.4 mmol/L palmitate for 48 h. A: Expression of Id1. Total RNA was extracted, reverse transcribed, and analyzed by real-time PCR in control (Con) siRNA-transfected cells pretreated with BSA (striped bars) or BSA-coupled palmitate (Palm) (white bars) and in Id1 siRNA-transfected cells pretreated with BSA (hatched bars) or BSA-coupled palmitate (black bars) (n = 5 separate experiments in each group). **P < 0.01 for palmitate effect in control siRNA-transfected cells, *P < 0.05 for palmitate effect in Id1 siRNA-transfected cells, ††P < 0.01 for effect of Id1 siRNA in BSA-treated cells, and †††P < 0.001 for effect of Id1 siRNA in palmitate-treated cells. B: Protein extracts were immunoblotted for Id1 or β-actin. Representative images are shown (n = 3 separate experiments in each group). CE: Control siRNA-transfected cells pretreated with BSA (striped bars) or BSA-coupled palmitate (white bars) and Id1 siRNA-transfected cells pretreated with BSA (hatched bars) or BSA-coupled palmitate (black bars). After pretreatment, cells were incubated in medium containing 2.8 or 25 mmol/L glucose (Gluc) for 1 h. Medium was taken to determine levels of insulin secretion (C), and results are expressed as a percentage of insulin secretion in control siRNA-transfected BSA-pretreated cells incubated with 25 mmol/L glucose (n = 4 separate experiments in each group; *P < 0.05 for effect of palmitate pretreatment in control siRNA-transfected cells at 25 mmol/L glucose and †P < 0.05 for effect of Id1 siRNA in palmitate-pretreated cells at 25 mmol/L glucose). Total insulin content (D) was determined in cell lysates (*P < 0.05 for effect of palmitate pretreatment in control siRNA-transfected cells and **P < 0.01 for effect of palmitate pretreatment in Id1 siRNA-transfected cells). Ratio of insulin secretion to total insulin content (E) expressed as a percentage of ratios in control siRNA-transfected BSA-pretreated cells incubated with 25 mmol/L glucose (†P < 0.05 for effect of Id1 siRNA in palmitate-pretreated cells at 25 mmol/L glucose).
FIG. 8.
FIG. 8.
Relative gene expression levels in MIN6 cells. MIN6 cells transfected with Id1 ON-TARGETplus SMARTpool siRNA or control Non-Targeting siRNA were treated with either 0.92% BSA alone or 0.92% BSA coupled to 0.4 mmol/L palmitate (Palm) for 48 h. Total RNA was extracted, reverse transcribed, and relative expression of the genes indicated determined by PCR for control siRNA-transfected cells treated with BSA (striped bars) or BSA-coupled palmitate (white bars) and Id1 siRNA-transfected cells treated with BSA (hatched bars) or BSA-coupled palmitate (black bars). Results are expressed as a percentage of mRNA levels in control (Con) siRNA-transfected cells treated with BSA (n = 4–7 in each group). *P < 0.05, **P < 0.01 for effect of palmitate treatment in control siRNA- and Id1 siRNA-transfected cells, †P < 0.05, and ††P < 0.01 for effect of Id1 siRNA in palmitate-treated cells.

Comment in

References

    1. Kahn SE, Zraika S, Utzschneider KM, Hull RL. The beta cell lesion in type 2 diabetes: there has to be a primary functional abnormality. Diabetologia 2009;52:1003–1012 - PMC - PubMed
    1. Prentki M, Nolan CJ. Islet beta cell failure in type 2 diabetes. J Clin Invest 2006;116:1802–1812 - PMC - PubMed
    1. Weir GC, Marselli L, Marchetti P, Katsuta H, Jung MH, Bonner-Weir S. Towards better understanding of the contributions of overwork and glucotoxicity to the beta-cell inadequacy of type 2 diabetes. Diabetes Obes Metab 2009;11(Suppl. 4):82–90 - PubMed
    1. Butler AE, Janson J, Bonner-Weir S, Ritzel R, Rizza RA, Butler PC. Beta-cell deficit and increased beta-cell apoptosis in humans with type 2 diabetes. Diabetes 2003;52:102–110 - PubMed
    1. Rahier J, Guiot Y, Goebbels RM, Sempoux C, Henquin JC. Pancreatic beta-cell mass in European subjects with type 2 diabetes. Diabetes Obes Metab 2008;10(Suppl. 4):32–42 - PubMed

Publication types

MeSH terms