. 2011 Nov;60(11):2892-902.
doi: 10.2337/db11-0341. Epub 2011 Sep 22.

Specific glucose-induced control of insulin receptor substrate-2 expression is mediated via Ca2+-dependent calcineurin/NFAT signaling in primary pancreatic islet β-cells

Affiliations

Specific glucose-induced control of insulin receptor substrate-2 expression is mediated via Ca2+-dependent calcineurin/NFAT signaling in primary pancreatic islet β-cells

Damien Demozay et al. Diabetes. 2011 Nov.

Abstract

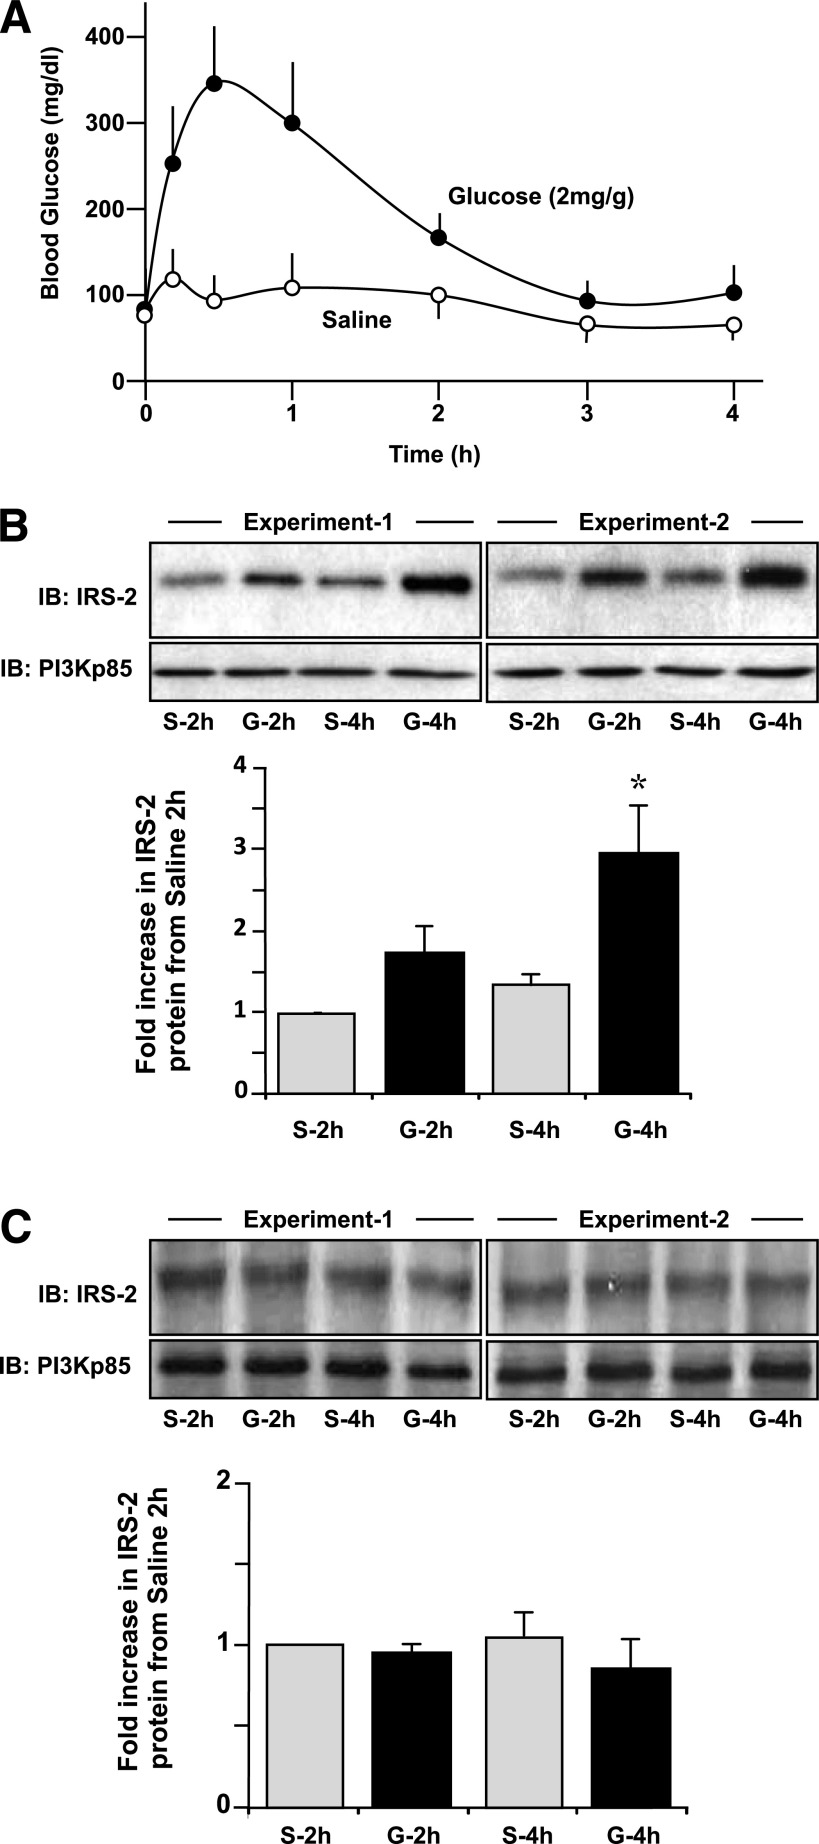
Objective: Insulin receptor substrate-2 (IRS-2) plays an essential role in pancreatic islet β-cells by promoting growth and survival. IRS-2 turnover is rapid in primary β-cells, but its expression is highly regulated at the transcriptional level, especially by glucose. The aim was to investigate the molecular mechanism on how glucose regulates IRS-2 gene expression in β-cells.

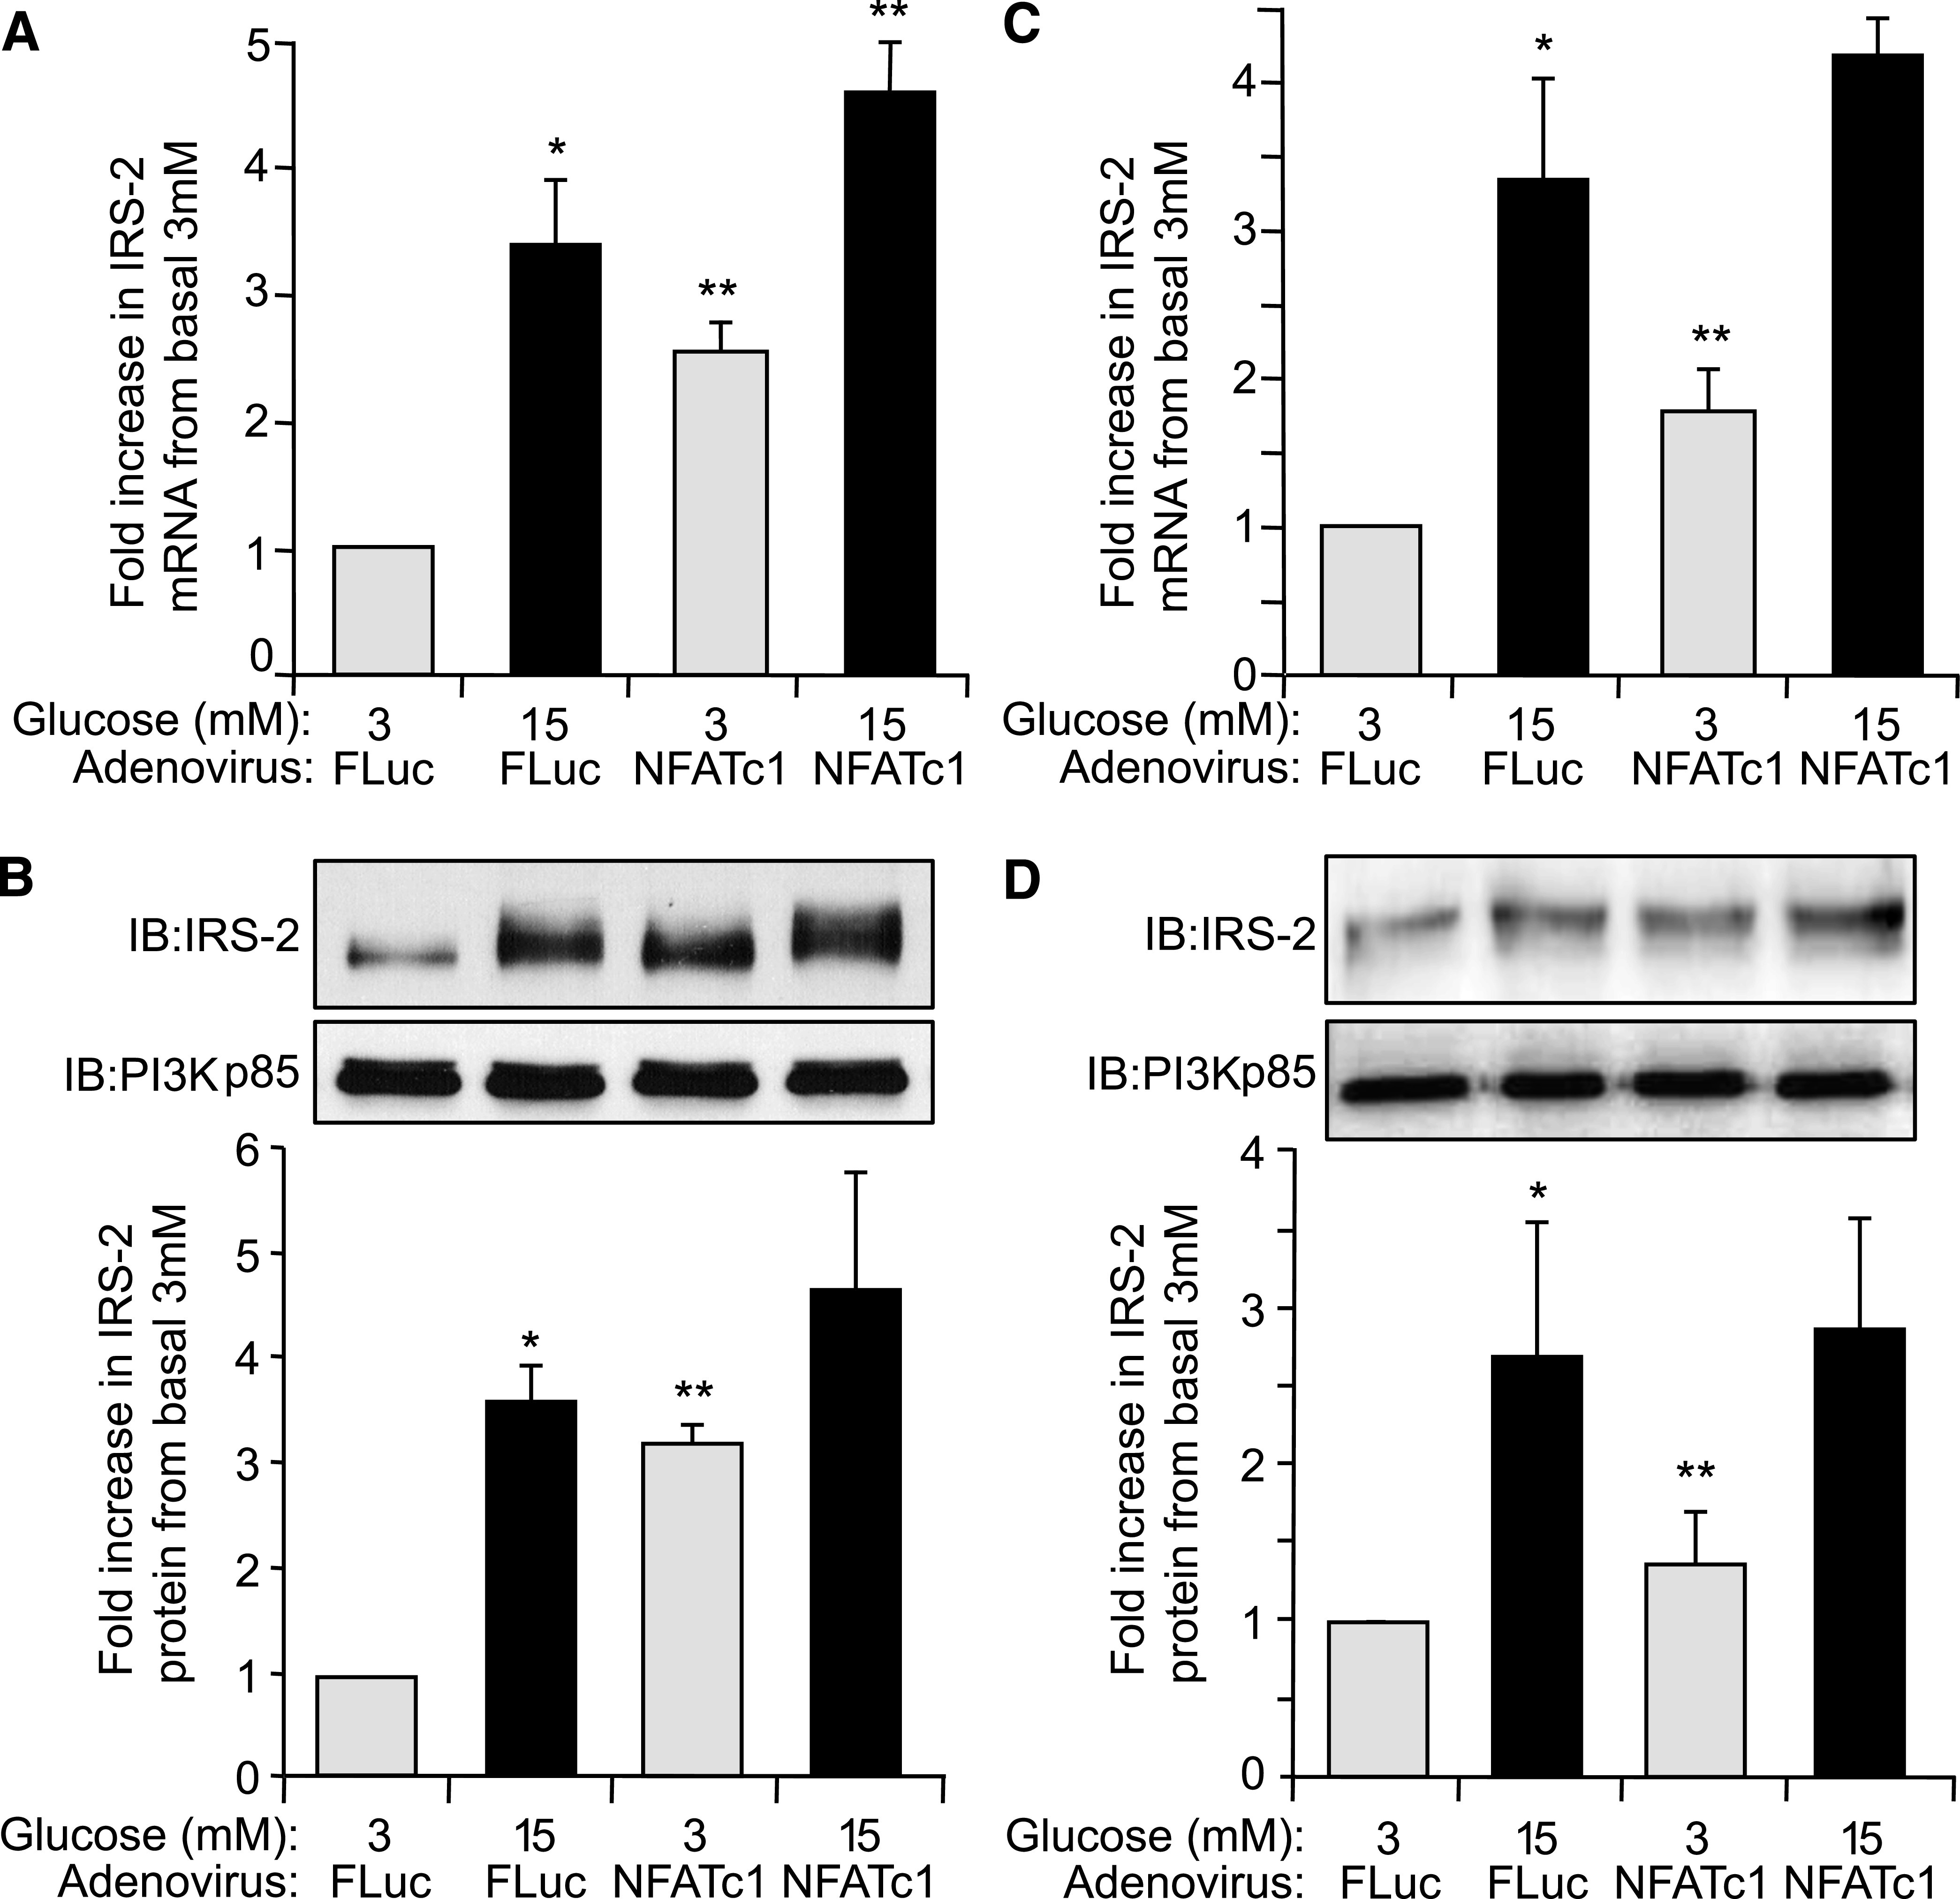
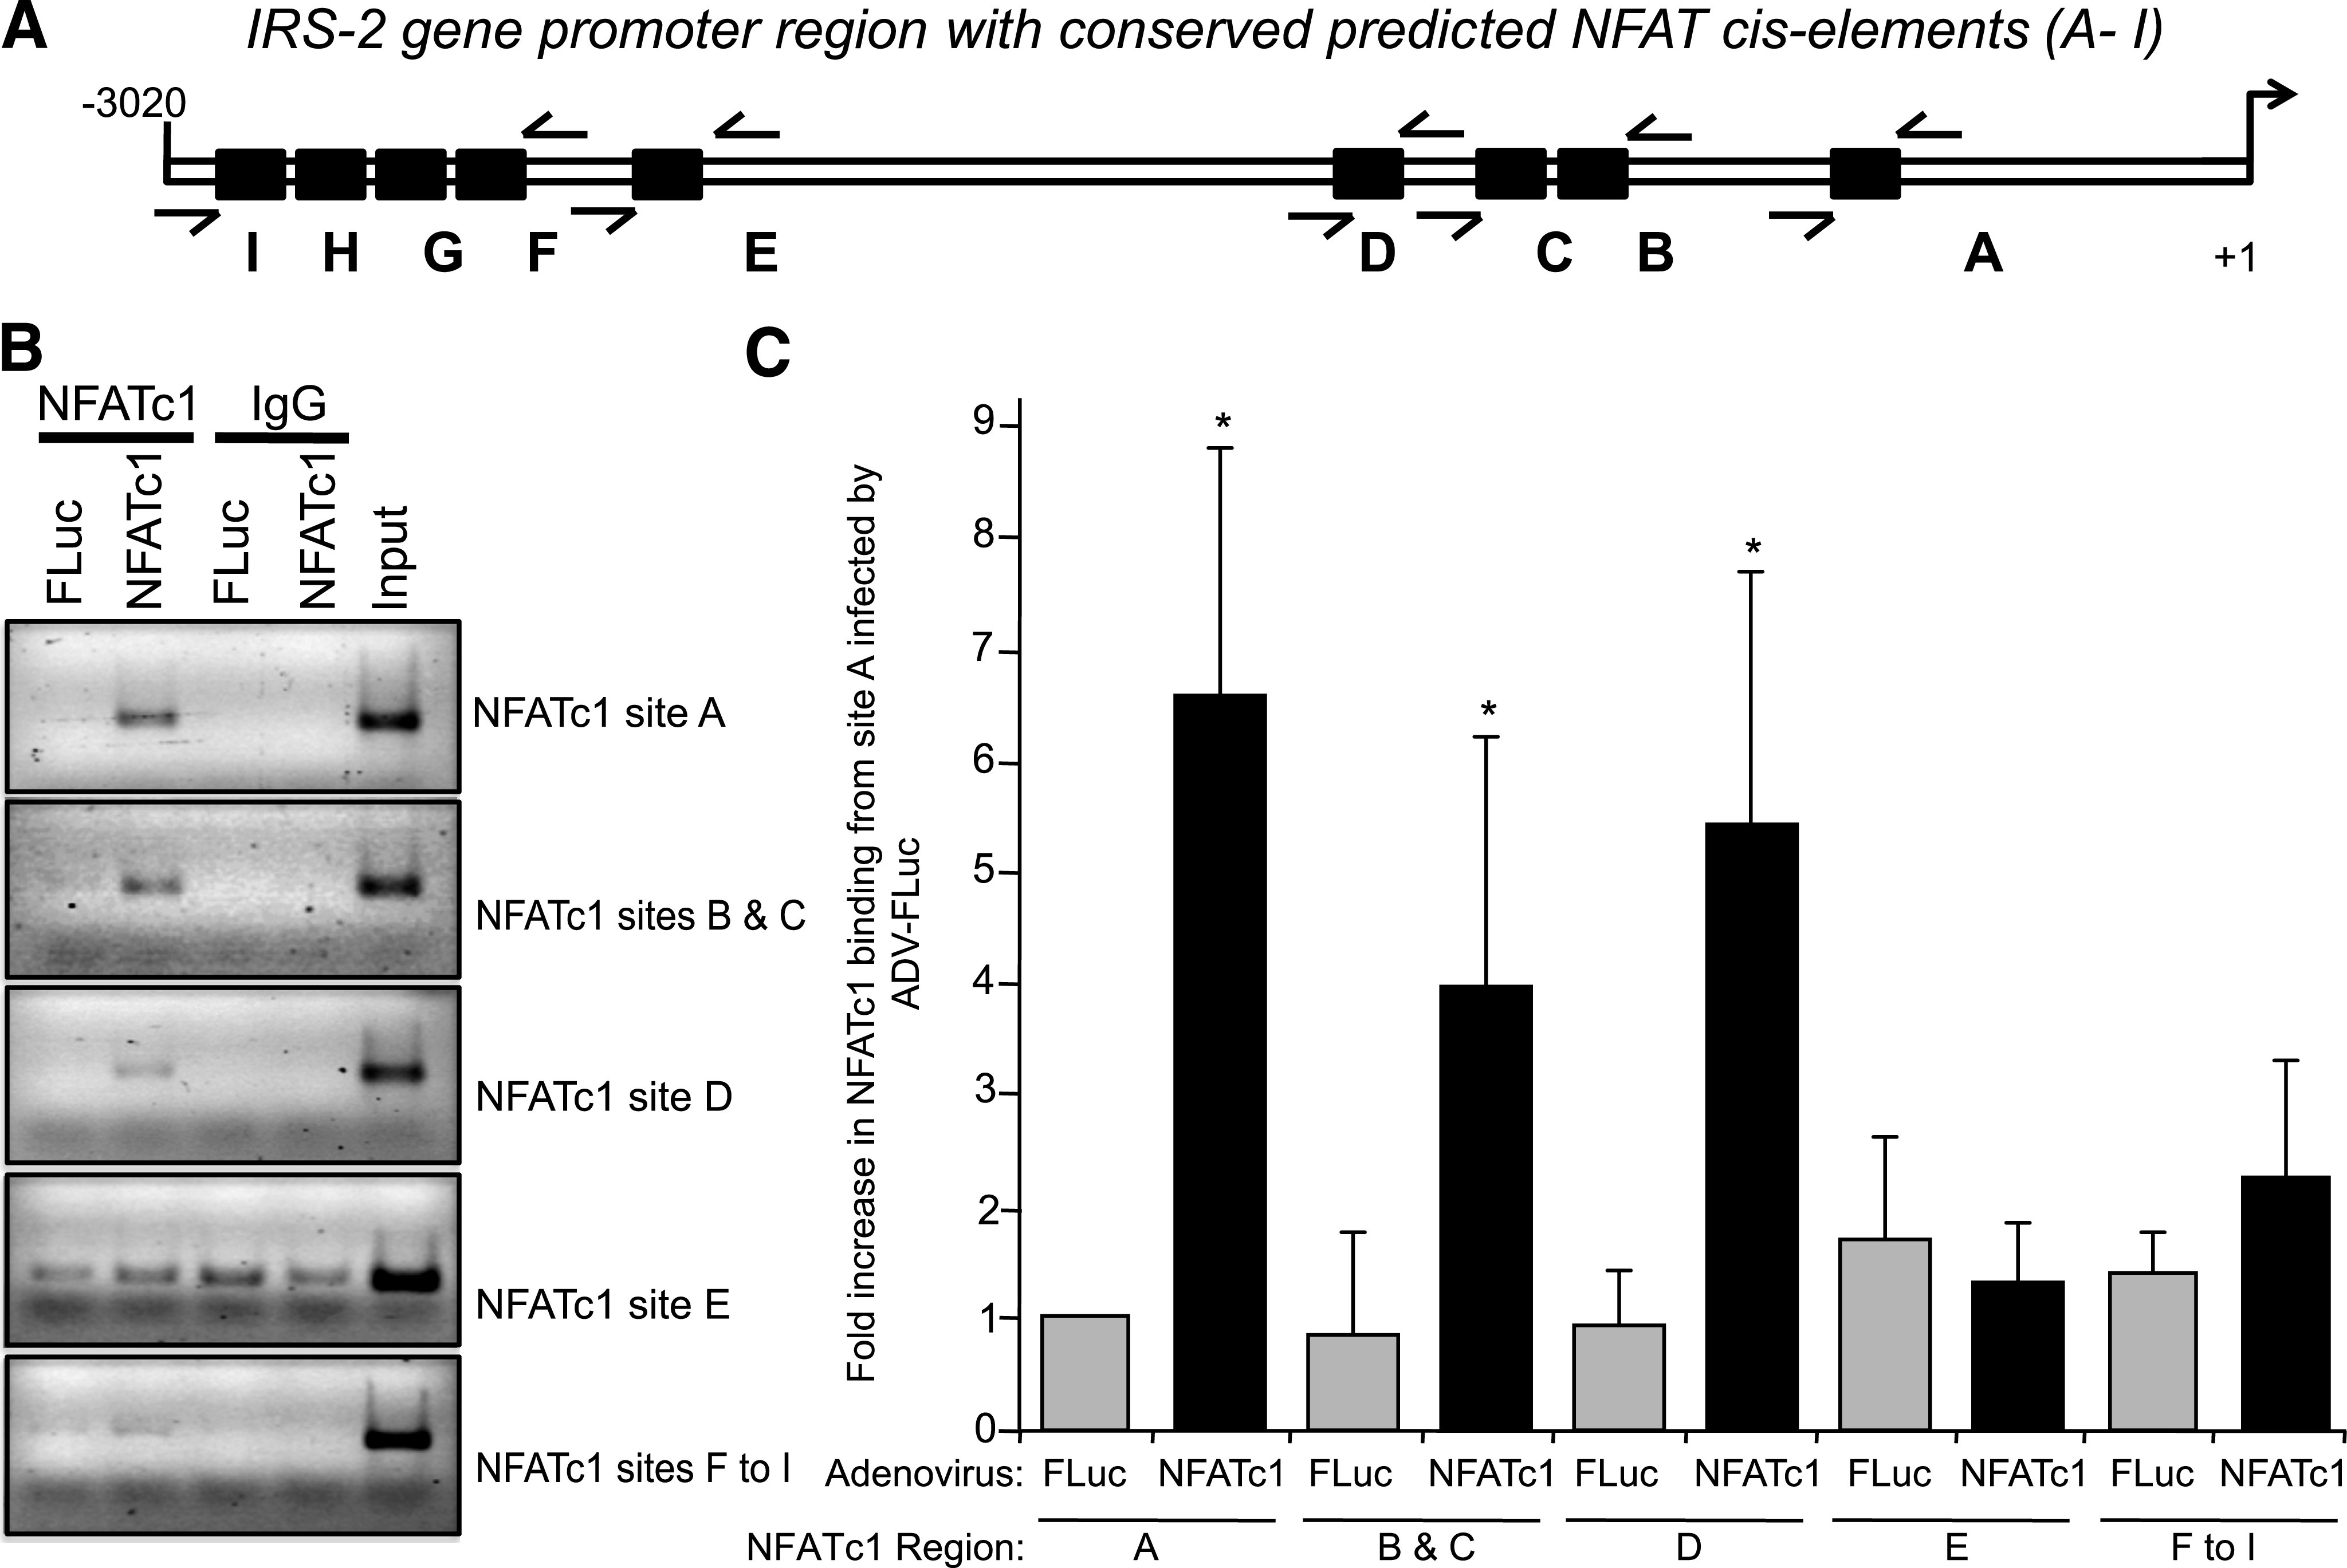
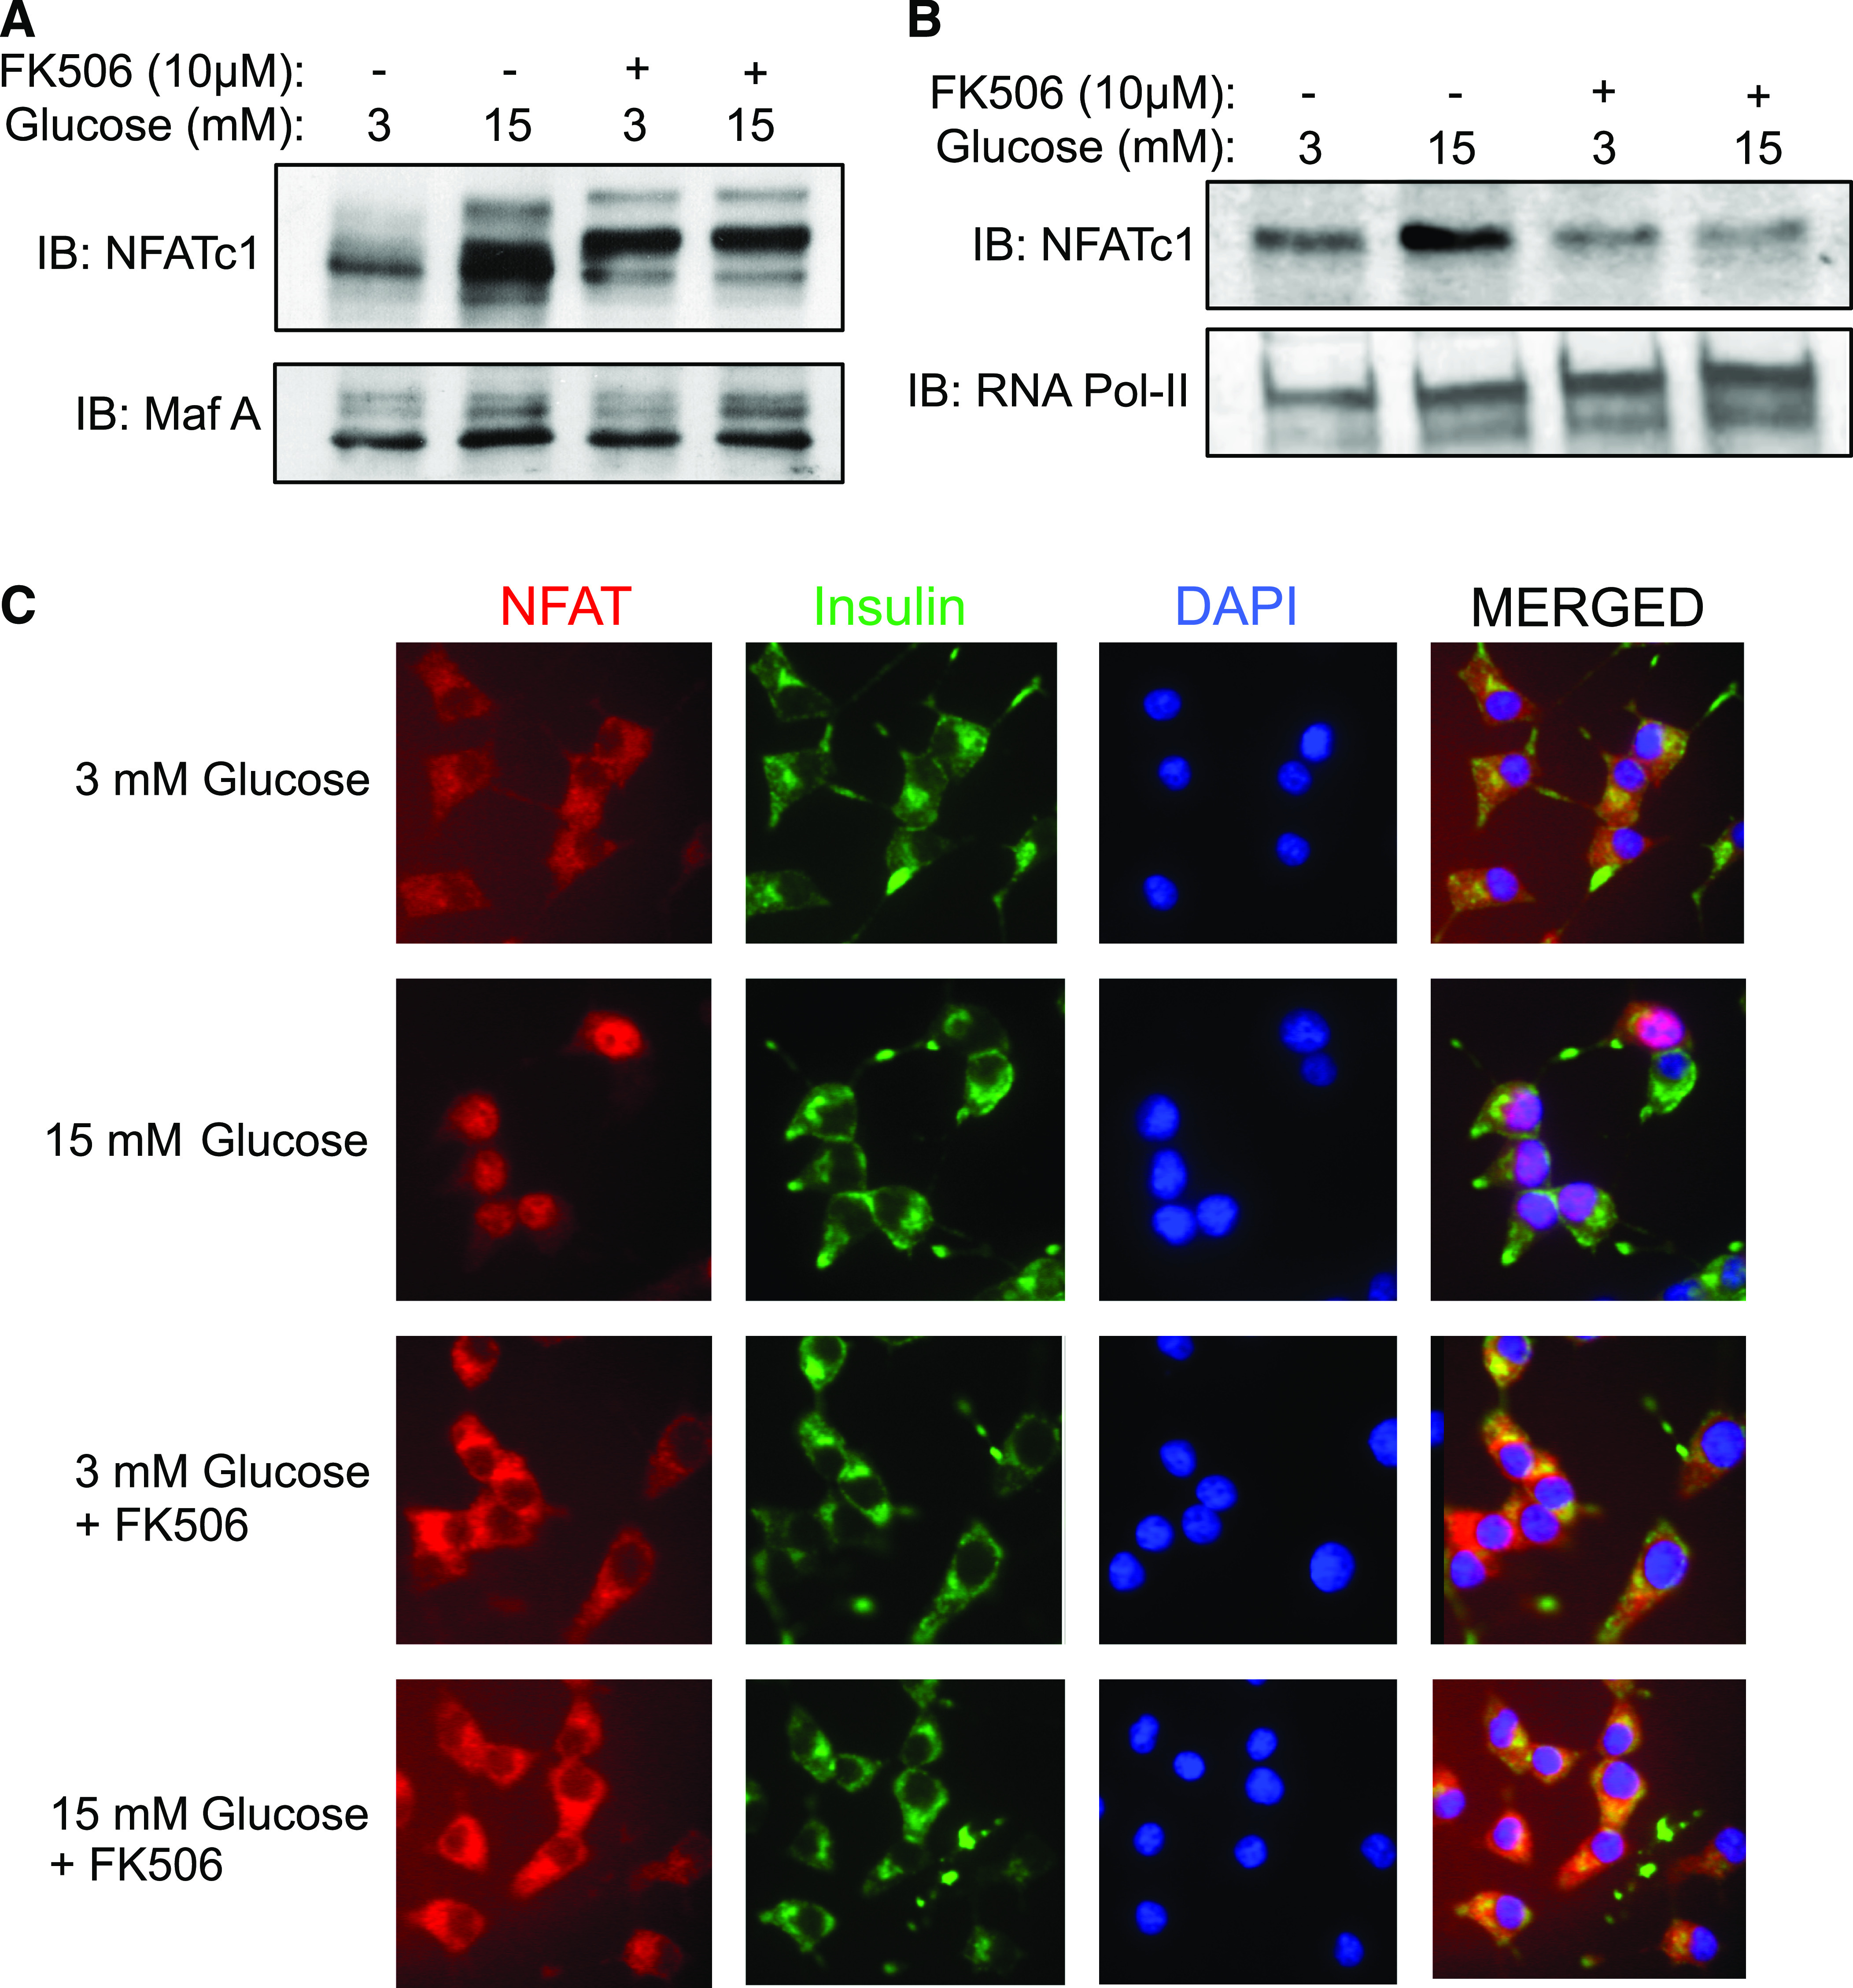
Research design and methods: Rat islets were exposed to inhibitors or subjected to adenoviral vector-mediated gene manipulations and then to glucose-induced IRS-2 expression analyzed by real-time PCR and immunoblotting. Transcription factor nuclear factor of activated T cells (NFAT) interaction with IRS-2 promoter was analyzed by chromatin immunoprecipitation assay and glucose-induced NFAT translocation by immunohistochemistry.

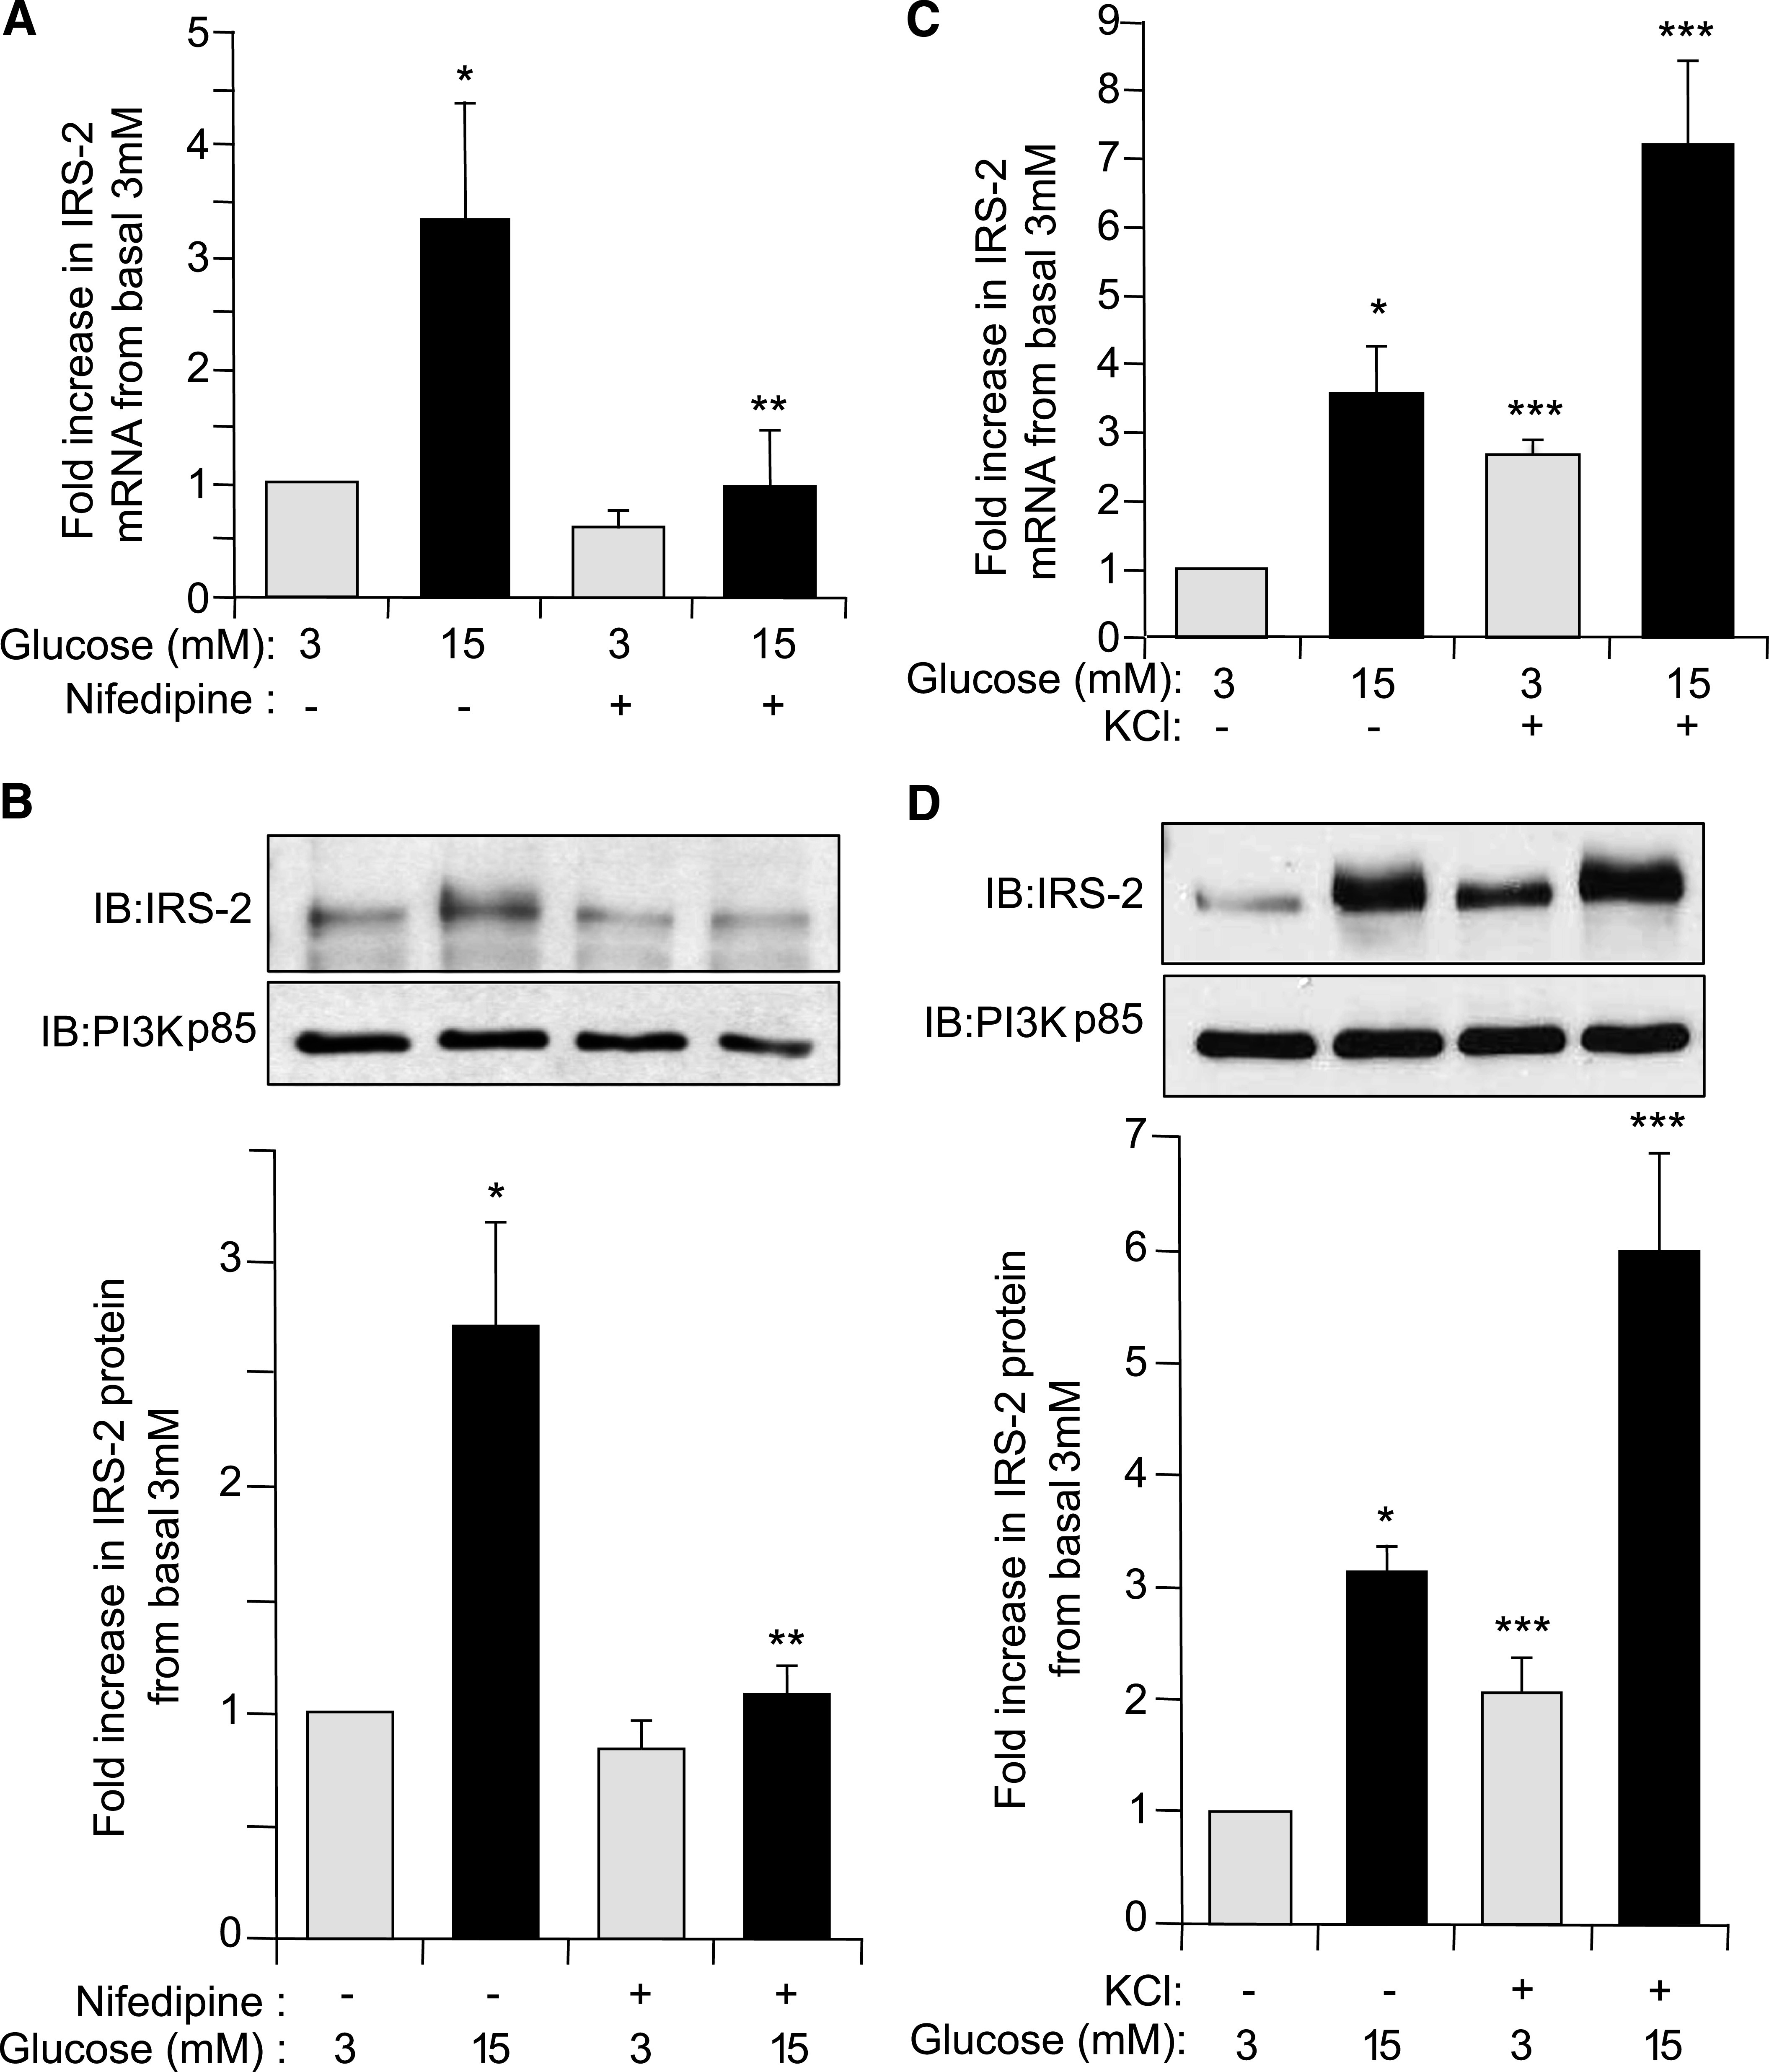
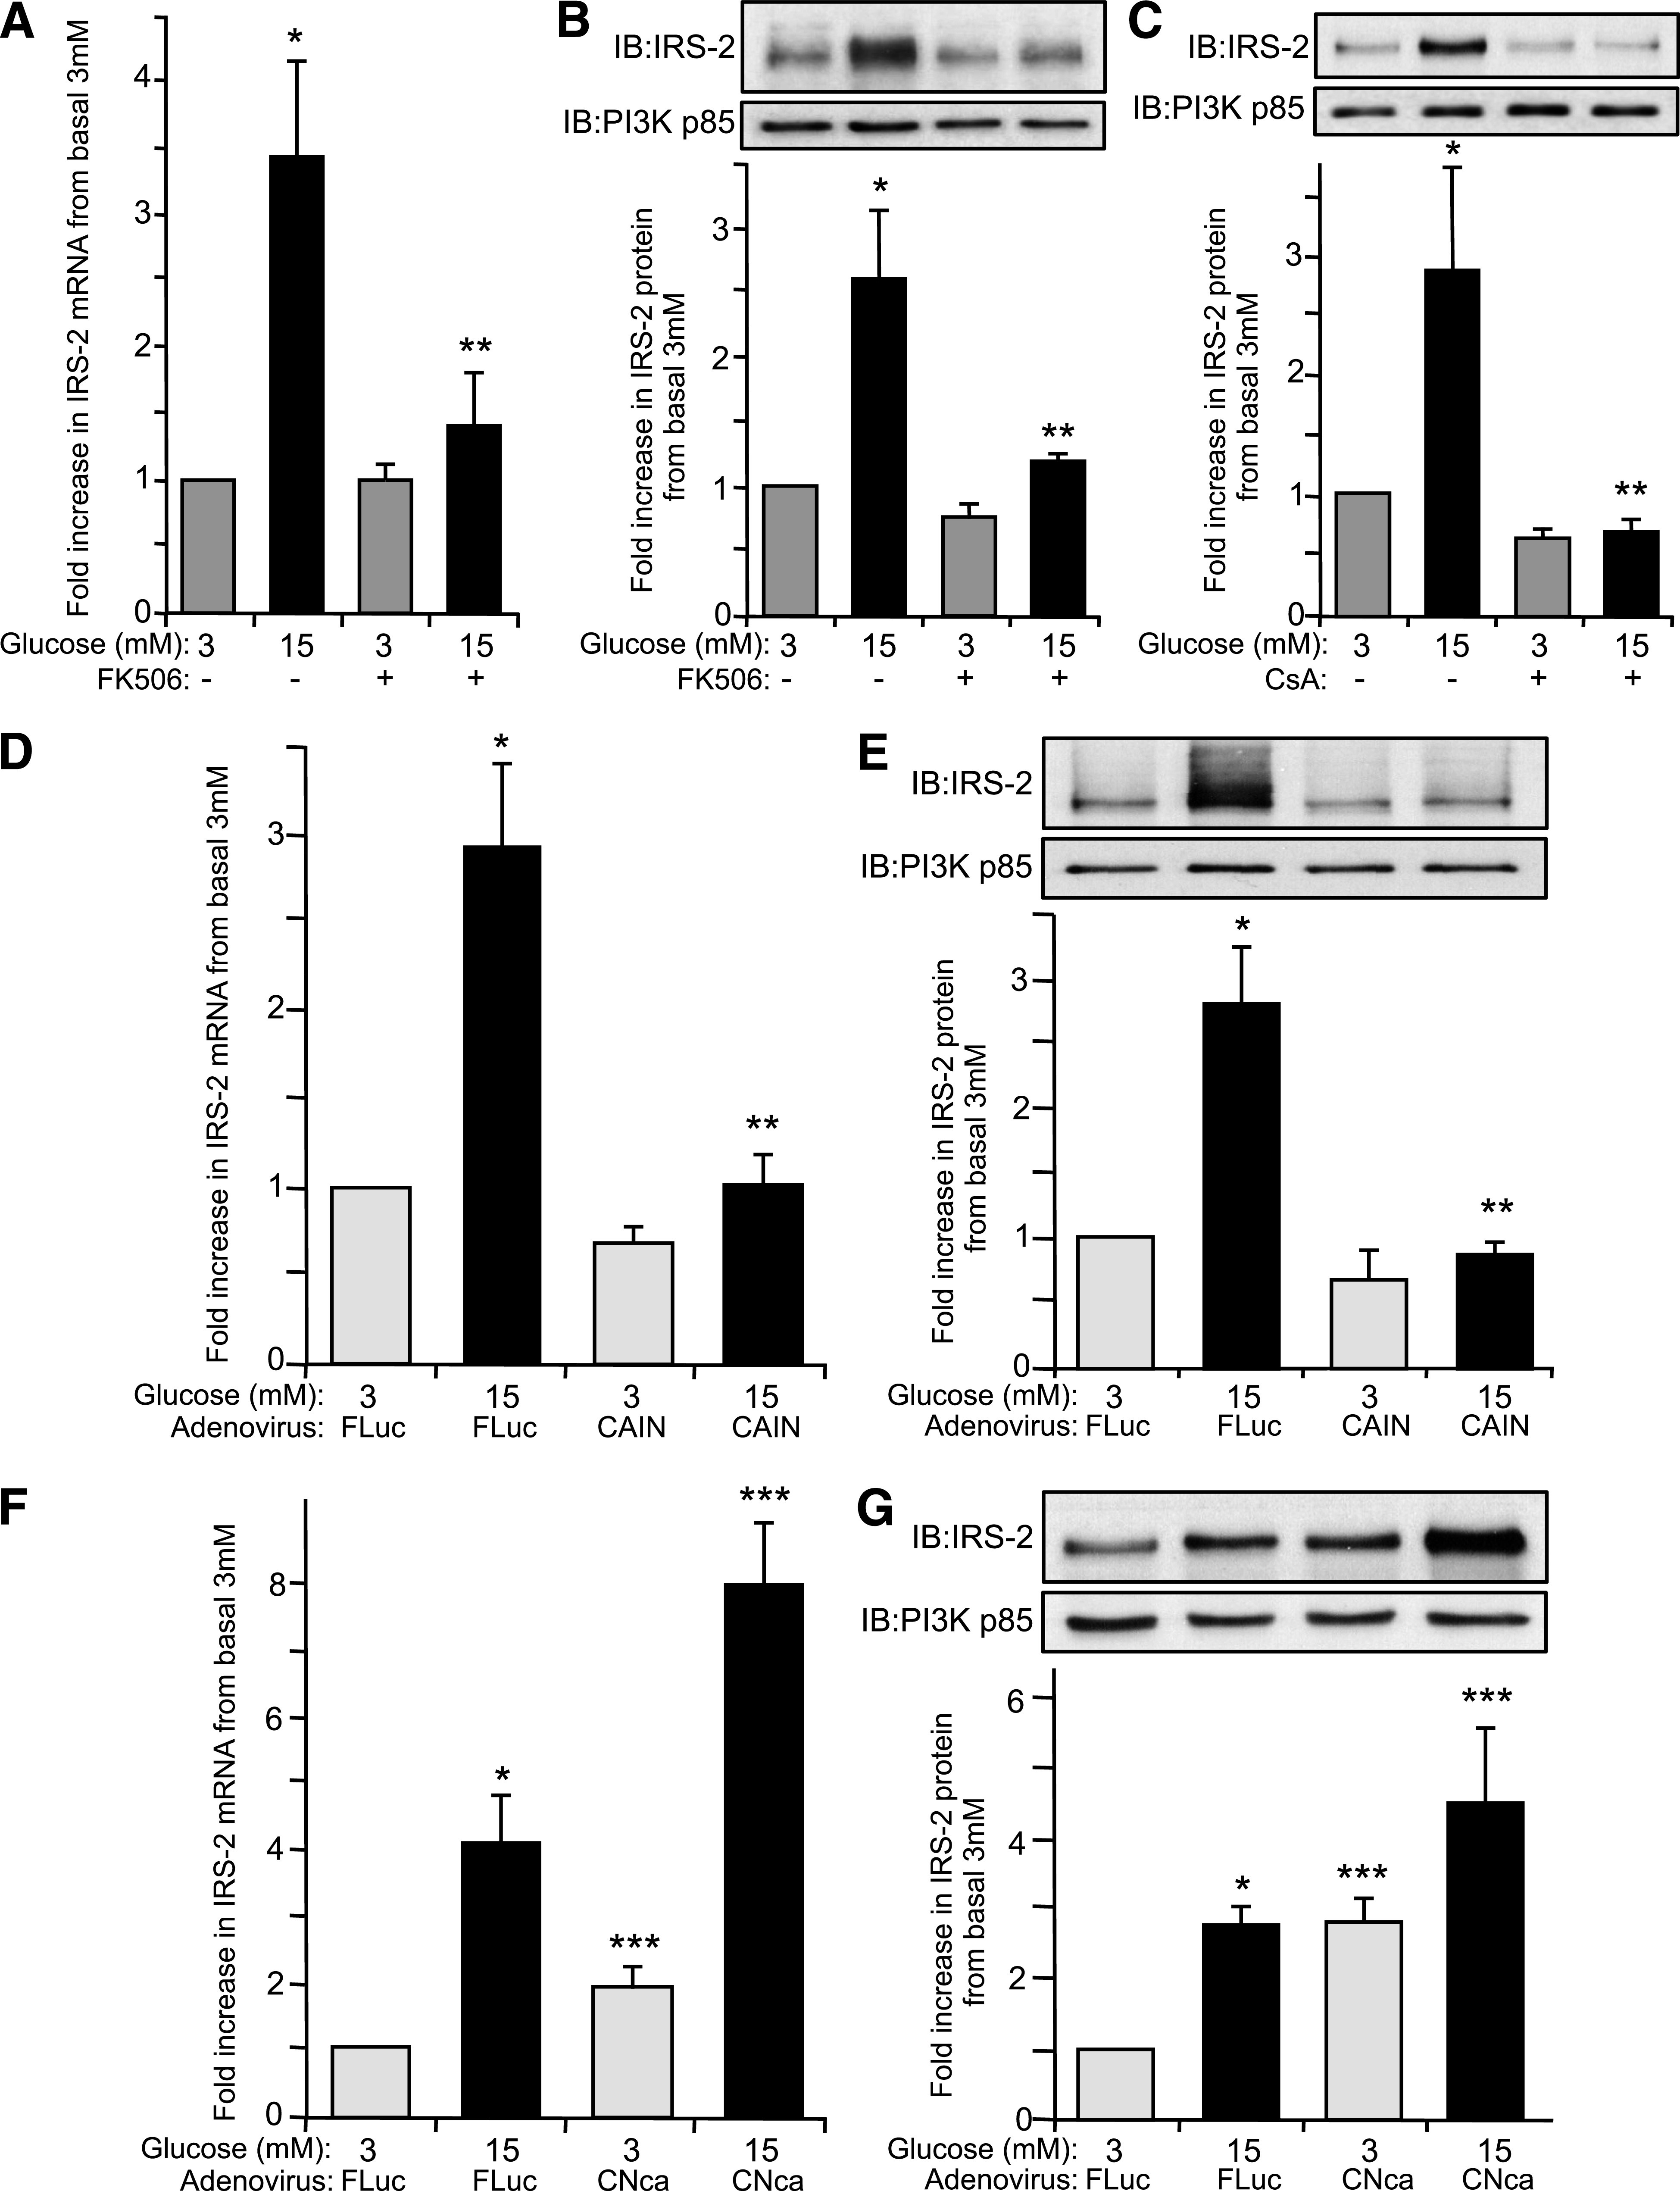
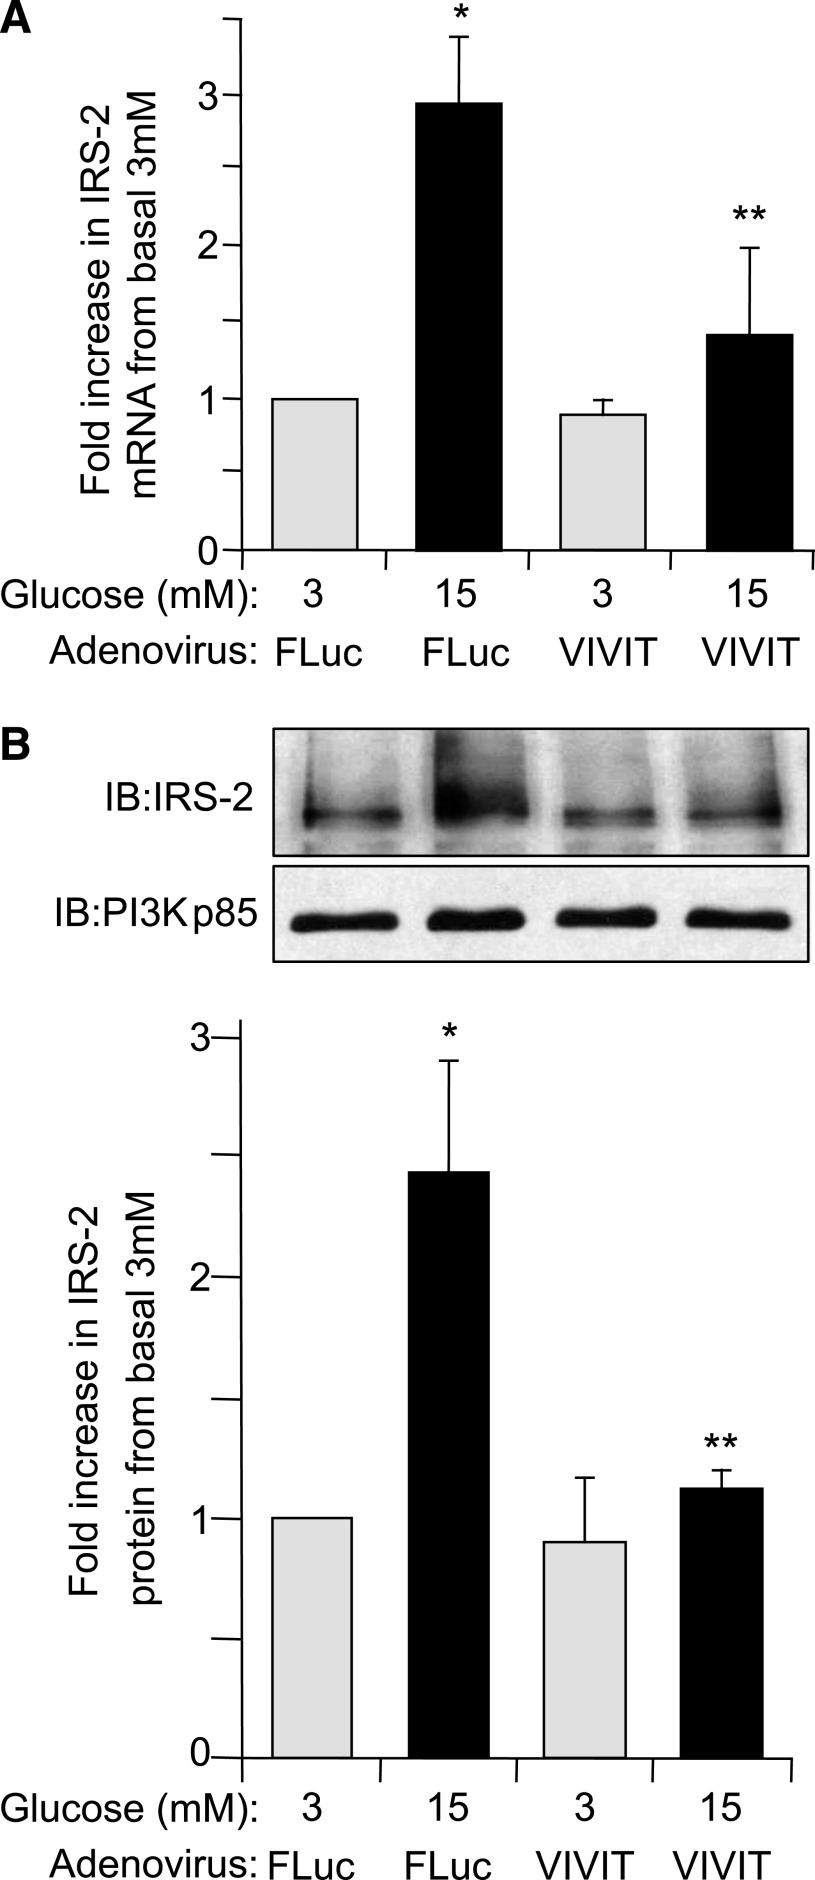
Results: Glucose-induced IRS-2 expression occurred in pancreatic islet β-cells in vivo but not in liver. Modulating rat islet β-cell Ca(2+) influx with nifedipine or depolarization demonstrated that glucose-induced IRS-2 gene expression was dependent on a rise in intracellular calcium concentration derived from extracellular sources. Calcineurin inhibitors (FK506, cyclosporin A, and a peptide calcineurin inhibitor [CAIN]) abolished glucose-induced IRS-2 mRNA and protein levels, whereas expression of a constitutively active calcineurin increased them. Specific inhibition of NFAT with the peptide inhibitor VIVIT prevented a glucose-induced IRS-2 transcription. NFATc1 translocation to the nucleus in response to glucose and association of NFATc1 to conserved NFAT binding sites in the IRS-2 promoter were demonstrated.

Conclusions: The mechanism behind glucose-induced transcriptional control of IRS-2 gene expression specific to the islet β-cell is mediated by the Ca(2+)/calcineurin/NFAT pathway. This insight into the IRS-2 regulation could provide novel therapeutic means in type 2 diabetes to maintain an adequate functional mass.


Figures

FIG. 1.
FIG. 1.
Specific glucose-induced regulation of IRS-2 expression in pancreatic islets, but not in hepatocytes in vivo. Normal C57Blk6/6J mice (aged 12 weeks) were fasted overnight and then subjected to an intraperitoneal glucose tolerance test (2 mg/g body wt) or using saline as a control as described (42). Pancreatic islets were isolated, and a liver biopsy was conducted at the 2- and 4-h time point and then subjected to immunoblot (IB) analysis for IRS-2 protein expression relative to PI3K(p85) as a loading control. A: Excursion in circulating glucose in the mice after a glucose (●) or saline (○) injection. A mean ± SE is shown (n ≥ 3). B and C: Example IB analyses of IRS-2 and PI3K(p85) in islets (B) and liver (C) from saline (S)- or glucose (G)-treated mice at 2 or 4 h are shown from two separate experiments. A quantification of a series of experiments is also depicted, where gray bars are S- and black bars are G-treated animals. Data are a mean ± SE (n = 3), where * indicates statistically significant difference (P ≤ 0.05) from the equivalent saline control.
FIG. 2.
FIG. 2.
Glucose regulation of IRS-2 expression in β-cells is dependent on increased cytosolic [Ca2+]i flux. Isolated rat pancreatic islets were cultured overnight at normal 5.6 mmol/L glucose and then incubated at either basal 3 mmol/L (gray bars) or stimulatory 15 mmol/L (black bars) glucose concentration for 6 h in presence or absence of either the voltage-sensitive L-type Ca2+-channel inhibitor nifedipine (50 µmol/L) (A and B) or KCl to depolarize β-cells (30 mmol/L) (C and D). A and C: IRS-2 and β-actin (internal reference control) mRNA expression levels were measured by real-time fluorescence-based quantitative RT-PCR. The data are shown as a mean ± SE above basal 3 mmol/L glucose control, where * indicates statistically significant difference (P ≤ 0.05) at 15 mmol/L glucose in the presence of nifedipine or KCl versus control (n ≥ 4). B and D: IRS-2 and PI3K(p85) (control) protein expression levels were analyzed by immunoblotting. Example immunoblots (IBs) are shown. Quantitative measurements are also shown as a mean ± SE, where * indicates statistically significant increase at 15 mmol/L glucose compared with basal 3 mmol/L glucose control, ** indicates statistically significant inhibition in the presence of nifedipine at 15 mmol/L glucose, and *** indicates statistically significant potentiation by KCl relative to the equivalent glucose concentration in the absence of KCl (P ≤ 0.05; n ≥ 4).
FIG. 3.
FIG. 3.
Glucose regulation of IRS-2 expression in β-cells is mediated by calcineurin. Isolated rat pancreatic islets were cultured overnight at normal 5.6 mmol/L glucose and then incubated at either basal 3 mmol/L or stimulatory 15 mmol/L glucose concentration for 6 h in presence or absence of calcineurin inhibitors FK506 (10 µmol/L) (A and B) or CsA (10 µmol/L) (C). A: IRS-2 and β-actin (internal reference control) mRNA expression levels were measured by real-time fluorescence-based quantitative RT-PCR. B and C: IRS-2 and PI3K(p85) (control) protein expression levels were analyzed by immunoblotting, where an example immunoblot (IB) is shown. Quantitative measurements are also shown as a mean ± SE above basal 3 mmol/L glucose control, where * indicates a statistically significant increase at 15 mmol/L glucose and ** indicates a statistically significant difference at 15 mmol/L glucose in the presence of FK506 or CsA versus control (P ≤ 0.05; n ≥ 4) (A–C). Isolated rat pancreatic islets were also infected with a recombinant AdV-CAIN (D and E), AdV-CNca (F and G), or AdV-FLuc and cultured overnight at normal 5.6 mmol/L glucose. Afterward, the adenovirally infected islets were then incubated at either basal 3 mmol/L or stimulatory 15 mmol/L glucose concentration for 6 h. D and F: IRS-2 and β-actin (internal reference control) mRNA expression levels were measured by real-time fluorescence-based quantitative RT-PCR. E and G: IRS-2 and PI3K(p85) (control) protein expression levels were analyzed by immunoblotting, where an example immunoblot is shown. The data are shown as a mean ± SE above basal 3 mmol/L glucose control, where * indicates a statistically significant increase at 15 mmol/L glucose above basal 3 mmol/L glucose, ** indicates a statistically significant inhibition with AdV-CAIN versus AdV-FLuc–infected control islets at 15 mmol/L glucose, and *** indicates a statistically significant increase in AdV-CNca–infected versus AdV-FLuc–infected control islets at the respective 3 and 15 mmol/L glucose concentrations (P ≤ 0.05; n ≥ 4) (DG).
FIG. 4.
FIG. 4.
Glucose regulation of IRS-2 expression in β-cells is decreased when NFAT is specifically inhibited. Isolated rat pancreatic islets were infected with a recombinant adenovirus expressing a specific peptide inhibitor of NFAT, AdV-VIVIT, or with AdV-FLuc and cultured overnight at normal 5.6 mmol/L glucose. Afterward, the adenovirally infected islets were then incubated at either basal 3 mmol/L or stimulatory 15 mmol/L glucose concentration for 6 h. A: IRS-2 and β-actin (internal reference control) mRNA expression levels were measured by real-time fluorescence-based quantitative RT-PCR. B: IRS-2 and PI3K(p85) (control) protein expression levels were analyzed by immunoblotting, where an example immunoblot (IB) and quantitative measurements are shown. The data are shown as a mean ± SE above basal 3 mmol/L glucose control, where * indicates a statistically significant increase at 15 mmol/L glucose above basal 3 mmol/L glucose and ** indicates statistically significant decrease at 15 mmol/L glucose in AdV-VIVIT–infected versus AdV-FLuc–infected control islets (P ≤ 0.05; n ≥ 4) (A and B).
FIG. 5.
FIG. 5.
Glucose regulation of IRS-2 expression in β-cells is enhanced by increased expression of NFATc1. INS-1 β-cells (A and C) or isolated rat pancreatic islets (B and D) were infected with AdV-NFATc1 or with AdV-FLuc and cultured overnight at normal 5.6 mmol/L glucose. Afterward, the adenovirally infected INS-1 β-cells or islets were then incubated at either basal 3 mmol/L or stimulatory 15 mmol/L glucose concentration for 6 h. A and C: IRS-2 and β-actin (internal reference control) mRNA expression levels were measured by real-time fluorescence-based quantitative RT-PCR. The data are shown as a mean ± SE, where * indicates a statistically significant increase at 15 mmol/L glucose above basal 3 mmol/L glucose and ** indicates a significant increase in AdV-NFATc1–infected islets versus AdV-FLuc–infected control islets at respective glucose concentrations (P ≤ 0.05; n ≥ 4). B and D: IRS-2 and PI3K(p85) (control) protein expression levels were analyzed by immunoblotting, where example immunoblots (IBs) are shown. Quantified data are also shown as a mean ± SE, where * indicates a statistically significant increase at 15 mmol/L glucose above basal 3 mmol/L glucose and ** indicates a significant increase in AdV-NFATc1–infected islets versus AdV-FLuc–infected control islets at basal 3 mmol/L glucose (P ≤ 0.05; n ≥ 4).
FIG. 6.
FIG. 6.
NFATc1 binds to rat IRS-2 gene promoter in β-cells. A: Predicted NFAT binding site elements on rat IRS-2 gene promoter. Examination of the rat IRS-2 gene promoter from −3,020 to +1 bp (transcription start point) showed multiple NFATc1 consensus sequences (GGAAA). Black boxes (A–I) represent NFAT consensus binding sites, and arrows indicates the five primer pairs used for the ChIP assay. B and C: Specific binding of NFATc1 to the endogenous rat IRS-2 promoter. INS-1 β-cells were infected with AdV-NFATc1, or AdV-Fluc as control, and the ChIP assay was performed using anti-NFATc1 antibody or Mouse IgG as a negative control. The input (B) corresponds to cross-linked and sheared chromatin. DNA fragments were then submitted to PCR amplification using primers to amplify five regions in the IRS-2 promoter containing the NFAT binding sites A, B and C together, D, E, or F through I as indicated above. PCR products were loaded onto an agarose gel, where an example is depicted (B). A series of ChIP assays were conducted (n = 6), and the combined data are shown as a mean ± SD above AdV-FLuc control for region A, where * indicates a significant increase (P ≤ 0.05) in AdV-NFATc1–infected cells versus control AdV-FLuc–infected cells (C).
FIG. 7.
FIG. 7.
Glucose induces NFATc1 translocation from cytosol to nucleus in β-cells. INS-1 β-cells (A and C) or isolated rat islets (B) were cultured overnight at 5.6 mmol/L glucose and then incubated at either basal 3 mmol/L or stimulatory 15 mmol/L glucose concentration for 6 h ± FK506 (10 µmol/L). A and B: Nuclear proteins were extracted and nuclear NFATc1 protein expression levels were analyzed by immunoblotting relative to a Maf-A (A) or RNA polymerase-II (Pol-II) (B) protein expression as loading controls. Example immunoblots (IBs) of three individual experiments are shown. C: Cellular localization of NFATc1 in INS-1 pancreatic β-cells. NFATc1 (red) localization was analyzed by immunofluorescence and confocal microscopy relative to insulin immunostaining (green) and nuclei staining by DAPI (blue). Example images of three individual experiments are shown. (A high-quality digital representation of this figure is available in the online issue.)

References

    1. Rhodes CJ. Type 2 diabetes-a matter of β-cell life and death? Science 2005;307:380–384 - PubMed
    1. Chang-Chen KJ, Mullur R, Bernal-Mizrachi E. Beta-cell failure as a complication of diabetes. Rev Endocr Metab Disord 2008;9:329–343 - PMC - PubMed
    1. Butler PC, Meier JJ, Butler AE, Bhushan A. The replication of beta cells in normal physiology, in disease and for therapy. Nat Clin Pract Endocrinol Metab 2007;3:758–768 - PubMed
    1. Withers DJ, Gutierrez JS, Towery H, et al. . Disruption of IRS-2 causes type 2 diabetes in mice. Nature 1998;391:900–904 - PubMed
    1. Withers DJ, Burks DJ, Towery HH, Altamuro SL, Flint CL, White MF. Irs-2 coordinates Igf-1 receptor-mediated beta-cell development and peripheral insulin signalling. Nat Genet 1999;23:32–40 - PubMed

Publication types

MeSH terms