

Immunomodulatory action of dietary fish oil and targeted deletion of intestinal epithelial cell PPARδ in inflammation-induced colon carcinogenesis
- PMID: 21940900
- PMCID: PMC3345959
- DOI: 10.1152/ajpgi.00315.2011
Immunomodulatory action of dietary fish oil and targeted deletion of intestinal epithelial cell PPARδ in inflammation-induced colon carcinogenesis
Abstract
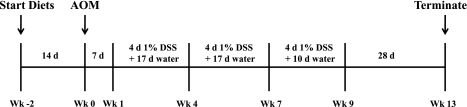
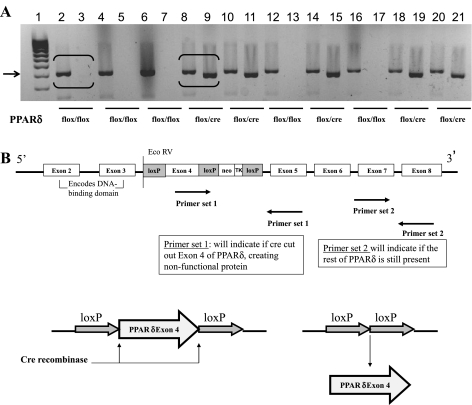
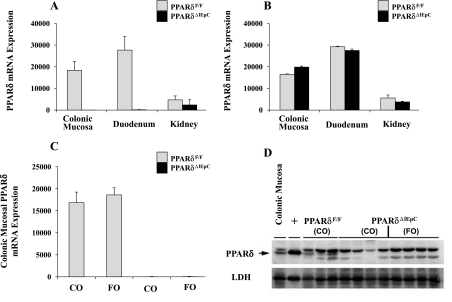
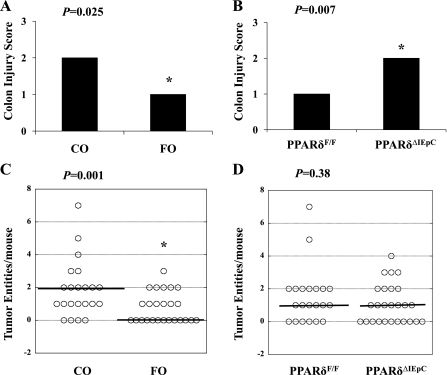
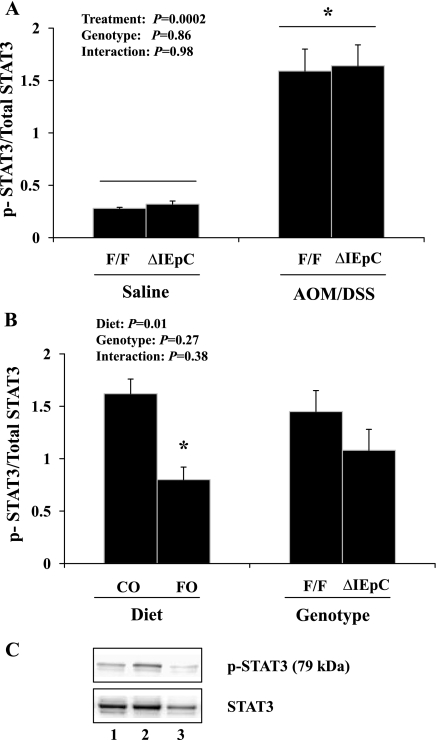
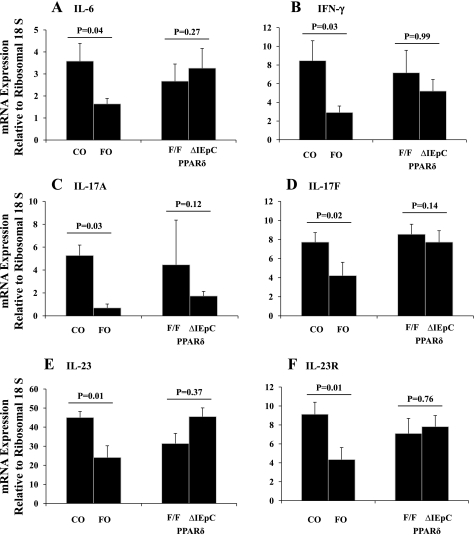
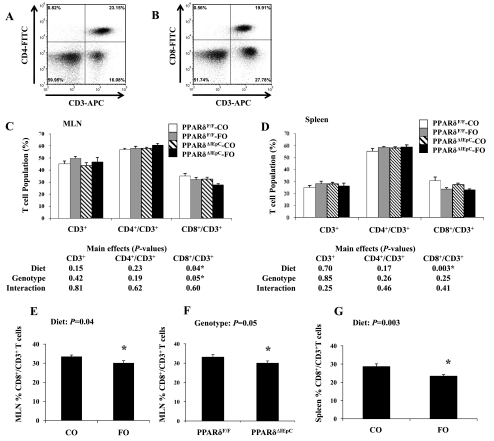
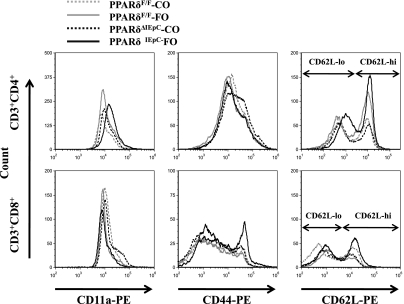
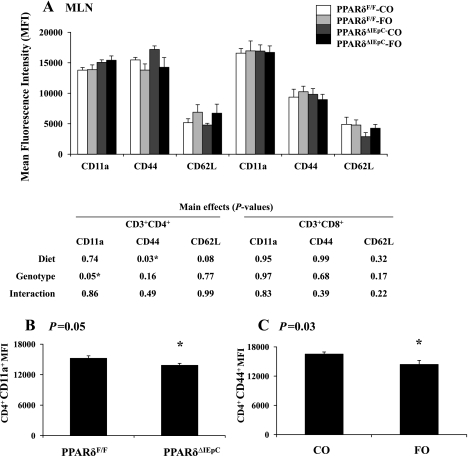
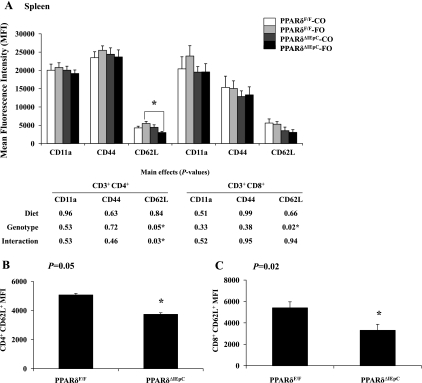
The ligand-activated transcription factor peroxisome proliferator-activated receptor (PPAR)-δ is highly expressed in colonic epithelial cells; however, the role of PPARδ ligands, such as fatty acids, in mucosal inflammation and malignant transformation has not been clarified. Recent evidence suggests that the anti-inflammatory/chemoprotective properties of fish oil (FO)-derived n-3 polyunsaturated fatty acids (PUFAs) may be partly mediated by PPARδ. Therefore, we assessed the role of PPARδ in modulating the effects of dietary n-3 PUFAs by targeted deletion of intestinal epithelial cell PPARδ (PPARδ(ΔIEpC)). Subsequently, we documented changes in colon tumorigenesis and the inflammatory microenvironment, i.e., local [mesenteric lymph node (MLN)] and systemic (spleen) T cell activation. Animals were fed chemopromotive [corn oil (CO)] or chemoprotective (FO) diets during the induction of chronic inflammation/carcinogenesis. Tumor incidence was similar in control and PPARδ(ΔIEpC) mice. FO reduced mucosal injury, tumor incidence, colonic STAT3 activation, and inflammatory cytokine gene expression, independent of PPARδ genotype. CD8(+) T cell recruitment into MLNs was suppressed in PPARδ(ΔIEpC) mice. Similarly, FO reduced CD8(+) T cell numbers in the MLN. Dietary FO independently modulated MLN CD4(+) T cell activation status by decreasing CD44 expression. CD11a expression by MLN CD4(+) T cells was downregulated in PPARδ(ΔIEpC) mice. Lastly, splenic CD62L expression was downregulated in PPARδ(ΔIEpC) CD4(+) and CD8(+) T cells. These data demonstrate that expression of intestinal epithelial cell PPARδ does not influence azoxymethane/dextran sodium sulfate-induced colon tumor incidence. Moreover, we provide new evidence that dietary n-3 PUFAs attenuate intestinal inflammation in an intestinal epithelial cell PPARδ-independent manner.
Figures
Similar articles
-
Dietary fish oil alters T lymphocyte cell populations and exacerbates disease in a mouse model of inflammatory colitis.Cancer Res. 2010 Oct 15;70(20):7960-9. doi: 10.1158/0008-5472.CAN-10-1396. Epub 2010 Aug 26. Cancer Res. 2010. PMID: 20798218
-
Porcine peroxisome proliferator-activated receptor delta mediates the lipolytic effects of dietary fish oil to reduce body fat deposition.J Anim Sci. 2010 Jun;88(6):2009-18. doi: 10.2527/jas.2009-2597. Epub 2010 Feb 26. J Anim Sci. 2010. PMID: 20190170
-
Dietary (n-6) and (n-3) fatty acids and energy restriction modulate mesenteric lymph node lymphocyte function in autoimmune-prone (NZB x NZW)F1 mice.J Nutr. 2000 Jul;130(7):1657-64. doi: 10.1093/jn/130.7.1657. J Nutr. 2000. PMID: 10867032
-
Targeting peroxisome proliferator-activated receptor-β/δ in colon cancer: how to aim?Biochem Pharmacol. 2013 Mar 1;85(5):607-611. doi: 10.1016/j.bcp.2012.09.031. Epub 2012 Oct 4. Biochem Pharmacol. 2013. PMID: 23041232 Free PMC article. Review.
-
The dual role of inflammation in colon carcinogenesis.Int J Mol Sci. 2012;13(9):11071-11084. doi: 10.3390/ijms130911071. Epub 2012 Sep 6. Int J Mol Sci. 2012. PMID: 23109839 Free PMC article. Review.
Cited by
-
Antagonizing arachidonic acid-derived eicosanoids reduces inflammatory Th17 and Th1 cell-mediated inflammation and colitis severity.Mediators Inflamm. 2014;2014:917149. doi: 10.1155/2014/917149. Epub 2014 Jul 17. Mediators Inflamm. 2014. PMID: 25136149 Free PMC article.
-
n3 PUFAs reduce mouse CD4+ T-cell ex vivo polarization into Th17 cells.J Nutr. 2013 Sep;143(9):1501-8. doi: 10.3945/jn.113.178178. Epub 2013 Jul 17. J Nutr. 2013. PMID: 23864512 Free PMC article.
-
Docosahexaenoic acid and eicosapentaenoic acid reduce C-reactive protein expression and STAT3 activation in IL-6-treated HepG2 cells.Mol Cell Biochem. 2013 May;377(1-2):97-106. doi: 10.1007/s11010-013-1574-1. Epub 2013 Jan 30. Mol Cell Biochem. 2013. PMID: 23361365
-
Dietary fish oil and DHA down-regulate antigen-activated CD4+ T-cells while promoting the formation of liquid-ordered mesodomains.Br J Nutr. 2014 Jan 28;111(2):254-60. doi: 10.1017/S0007114513002444. Epub 2013 Aug 20. Br J Nutr. 2014. PMID: 23962659 Free PMC article.
-
Integrative and systemic approaches for evaluating PPARβ/δ (PPARD) function.Nucl Recept Signal. 2015 Apr 27;13:e001. doi: 10.1621/nrs.13001. eCollection 2015. Nucl Recept Signal. 2015. PMID: 25945080 Free PMC article. Review.
References
-
- Abraham C, Griffith J, Miller J. The dependence for leukocyte function-associated antigen-1/ICAM-1 interactions in T cell activation cannot be overcome by expression of high density TCR ligand. J Immunol 162: 4399–4405, 1999 - PubMed
-
- Akiyama TE, Meinke PT, Berger JP. PPAR ligands: potential therapies for metabolic syndrome. Curr Diab Rep 5: 45–52, 2005 - PubMed
-
- Bachmann MF, McKall-Faienza K, Schmits R, Bouchard D, Beach J, Speiser DE, Mak TW, Ohashi PS. Distinct roles for LFA-1 and CD28 during activation of naive T cells: adhesion versus costimulation. Immunity 7: 549–557, 1997 - PubMed
Publication types
MeSH terms
Substances
Grants and funding
LinkOut - more resources
Full Text Sources
Molecular Biology Databases
Research Materials
Miscellaneous