. 2012 Mar;19(3):501-10.
doi: 10.1038/cdd.2011.119. Epub 2011 Sep 23.

The AMPK stress response pathway mediates anoikis resistance through inhibition of mTOR and suppression of protein synthesis

Affiliations

The AMPK stress response pathway mediates anoikis resistance through inhibition of mTOR and suppression of protein synthesis

T L Ng et al. Cell Death Differ. 2012 Mar.

Abstract

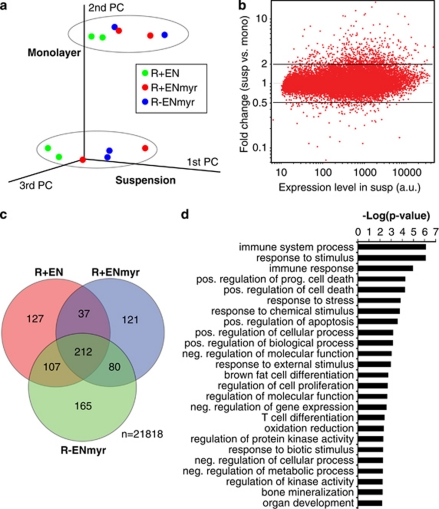
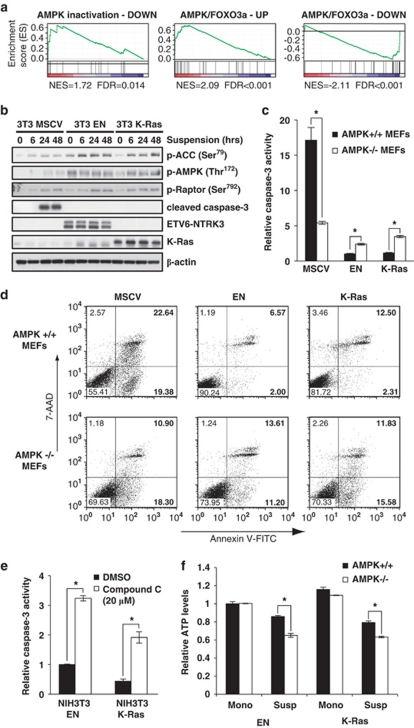
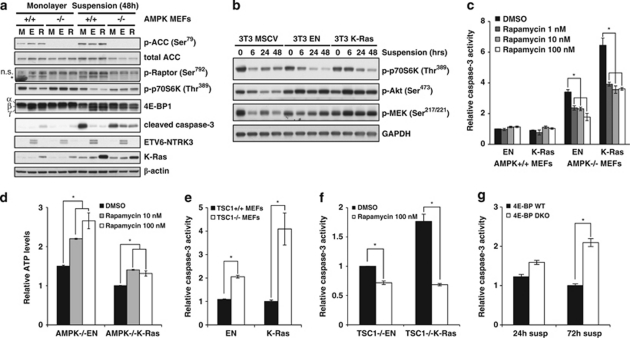
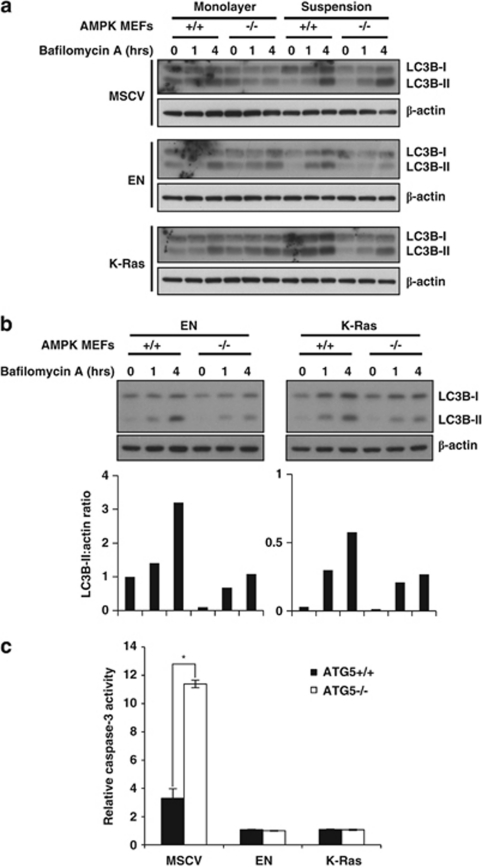
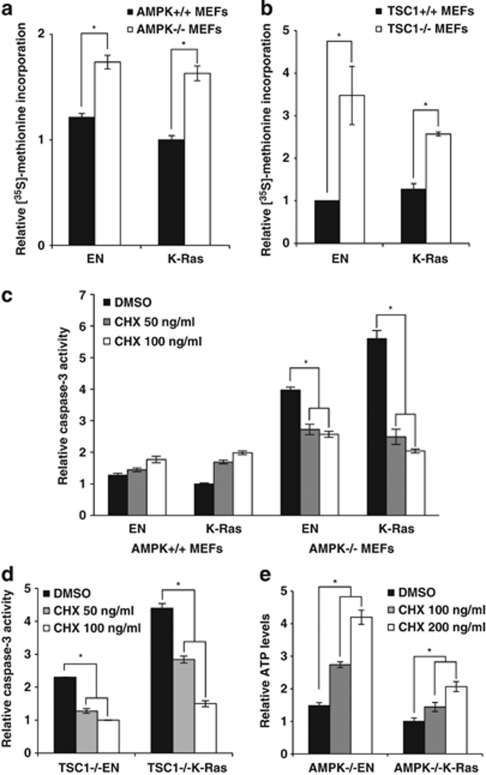
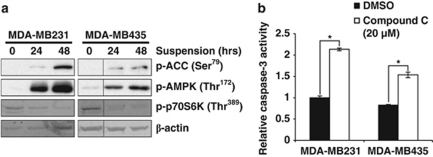
Suppression of anoikis after detachment of cancer cells from the extracellular matrix is a key step during metastasis. Here we show that, after detachment, mouse embryonic fibroblasts (MEFs) transformed by K-Ras(V12) or ETV6-NTRK3 (EN) activate a transcriptional response overrepresented by genes related to bioenergetic stress and the AMP-activated protein kinase (AMPK) energy-sensing pathway. Accordingly, AMPK is activated in both transformed and non-transformed cells after detachment, and AMPK deficiency restores anoikis to transformed MEFs. However, AMPK activation represses the mTOR complex-1 (mTORC1) pathway only in transformed cells, suggesting a key role for AMPK-mediated mTORC1 inhibition in the suppression of anoikis. Consistent with this, AMPK-/- MEFs transformed by EN or K-Ras show sustained mTORC1 activation after detachment and fail to suppress anoikis. Transformed TSC1-/- MEFs, which are incapable of suppressing mTORC1, also undergo anoikis after detachment, which is reversed by mTORC1 inhibitors. Furthermore, transformed AMPK-/- and TSC1-/- MEFs both have higher total protein synthesis rates than wild-type controls, and translation inhibition using cycloheximide partially restores their anoikis resistance, indicating a mechanism whereby mTORC1 inhibition suppresses anoikis. Finally, breast carcinoma cell lines show similar detachment-induced AMPK/mTORC1 activation and restoration of anoikis by AMPK inhibition. Our data implicate AMPK-mediated mTORC1 inhibition and suppression of protein synthesis as a means for bioenergetic conservation during detachment, thus promoting anoikis resistance.


Figures

Figure 1
Figure 1
Cellular detachment induces a multi-faceted transcriptional pattern resembling diverse bioenergetic stress responses. (a) Principal-component analysis illustrating the three largest sources of variation in GEPs, showing clustering of samples based primarily on culture conditions (suspension versus monolayer). (b) Scatter-plot summarizing the mean fold changes of individual genes in suspension as compared with monolayer culture (y-axis) as a function of the mean expression of each gene in all suspension culture samples (x-axis). (c) Venn diagram depicting the overlap of upregulated gene probesets in suspension for the indicated EN-transformed cell lines used in the microarray analysis. (d) GO biological process categories overrepresented in the 170 genes upregulated after detachment in all three EN-transformed cell lines (Supplementary Table S1), for all categories with FDR<0.10. The x-axis represents the negative log of the DAVID significance score P-values
Figure 2
Figure 2
The AMPK pathway is activated after cellular detachment and promotes anoikis resistance. (a) GSEA analysis of detachment-induced GEPs using annotated data sets from the literature of genes known to be altered after AMPK pathway modulation. (b) Western blot demonstrating levels of p-ACC, p-Raptor, and p-AMPK as readouts of AMPK pathway activation at various time points after detachment of transformed and non-transformed NIH3T3 cells. EN and K-Ras(V12) levels are shown by NTRK3 and K-Ras immunoblotting, respectively. Cleaved caspase-3 immunoblotting demonstrates levels of apoptosis in transformed versus non-transformed cells. β-Actin is used as a loading control. (c and d) Caspase-3 activity assay and annexin-V/7-AAD FACS analysis of MSCV vector-alone-, EN-, or K-Ras-transformed AMPK+/+ versus AMPK−/− MEFs after 48 h in suspension. (e) Caspase-3 activity assay of EN- or K-Ras-transformed NIH3T3 cells treated with compound-C immediately after detachment and cultured in suspension for 48 h. (f) ATP assay of EN- or K-Ras-transformed AMPK+/+ versus −/− MEFs following 24 h in suspension. All data are shown as mean±S.E.M. (n=3). The asterisk indicates statistical significance as determined by Student's t-test (P<0.05)
Figure 3
Figure 3
mTORC1 pathway inhibition is dependent on both AMPK activation and oncogenic transformation, and promotes anoikis resistance. (a) Western blot of transformed and non-transformed AMPK+/+ versus AMPK−/− MEFs 48 h after plating as monolayer or suspension cultures, using antibodies against the indicated proteins as pathway readouts for AMPK (p-ACC and p-Raptor) and mTORC1 (p-p70S6K and 4E-BP1). EN and K-Ras(V12) levels are demonstrated as in Figure 2b; cleaved caspase-3 levels are shown to reflect levels of apoptosis; and β-actin is used as a loading control. (b) Western blot of NIH3T3 cells expressing MSCV vector alone versus EN or K-Ras(V12) demonstrating the indicated readouts of mTORC1 (p-p70S6K), PI3K-Akt (p-Akt), and Ras-ERK (p-MEK) pathway activities at various time points after detachment. GAPDH is used as a loading control. (c) Caspase-3 activity assay of EN- or K-Ras-transformed AMPK+/+ versus −/− MEFs treated with a dose–response curve of rapamycin immediately after detachment, and cultured in suspension for 48 h. (d) ATP assay of rapamycin-treated, EN- or K-Ras-expressing AMPK−/− MEFs after 24 h in suspension. (e) Caspase-3 activity assay of EN- or K-Ras-transformed TSC1+/+ versus TSC1−/− MEFs subjected to 48 h in suspension. (f) Caspase-3 activity assay of EN- or K-Ras-expressing TSC1−/− MEFs treated with rapamycin and subjected to 48 h in suspension. (g) Caspase-3 activity assay of 4E-BP1 wt versus DKO MEFs expressing E1A/Ras at 24 and 72 h after detachment. All data are shown as mean±S.E.M. (n=3). The asterisk indicates statistical significance as determined by Student's t-test (P<0.05)
Figure 4
Figure 4
Autophagic flux is increased after cellular detachment, but loss of autophagy is insufficient to restore anoikis in EN- or K-Ras-transformed cells. (a) Western blot of LC3B-II levels in AMPK+/+ versus AMPK−/− MEFs expressing EN or K-Ras versus MSCV vector alone after bafilomycin-A inhibition to assay for autophagic flux in monolayer versus 24-h suspension cultures. β-Actin is used as a loading control. (b) Densitometric quantification of the ratios of LC3B-II/β-actin immunoblot levels in EN- or K-Ras-transformed AMPK+/+ versus AMPK−/− MEFs. (c) Caspase-3 activity in EN- or K-Ras-, or MSCV vector-alone-expressing ATG5+/+ versus ATG5−/− MEFs after 72 h in suspension. All data are shown as mean±S.E.M. (n=3). The asterisk indicates statistical significance as determined by Student's t-test (P<0.05)
Figure 5
Figure 5
Inhibition of protein synthesis partially restores ATP levels and promotes anoikis resistance in cells with sustained mTORC1 activity after cellular detachment. (a and b) Assay of global protein synthesis rates as measured by levels of 35S-methionine/cysteine incorporation into newly synthesized proteins in AMPK+/+ or TSC1+/+ versus AMPK−/− or TSC1−/− MEFs expressing EN or K-Ras 48 h after detachment. (c) Caspase-3 activity in AMPK+/+ versus AMPK−/− EN- or K-Ras-transformed MEFs treated with low-dose CHX and assayed after 48 h in suspension. (d) Caspase-3 activity in CHX-treated TSC1−/− MEFs transformed with EN or K-Ras after 48 h in suspension. (e) ATP levels in CHX-treated AMPK−/− MEFs transformed with EN or K-Ras after 24 h in suspension. All data are shown as mean±S.E.M. (n=3). The asterisk indicates statistical significance as determined by Student's t-test (P<0.05)
Figure 6
Figure 6
Anoikis-resistant breast carcinoma cell lines activate AMPK and suppress mTORC1 after detachment, and AMPK inhibition partially restores anoikis. (a) Western blot demonstrating levels of p-ACC, p-AMPK, and p-p70S6 K as readouts of AMPK and mTORC1 pathway activity in MDA-MB-231 and MDA-MB-435 breast cancer cell lines at the indicated time points after detachment. β-Actin is used as a loading control. (b) Caspase-3 activity assay of MDA-MB-231 and MDA-MB-435 cell lines treated with compound-C immediately after detachment and cultured in suspension for 48 h. All data are shown as mean±S.E.M. (n=3). The asterisk indicates statistical significance as determined by Student's t-test (P< 0.05)

References

    1. Frisch SM, Francis H. Disruption of epithelial cell–matrix interactions induces apoptosis. J Cell Biol. 1994;124:619–626. - PMC - PubMed
    1. Simpson CD, Anyiwe K, Schimmer AD. Anoikis resistance and tumor metastasis. Cancer Lett. 2008;272:177–185. - PubMed
    1. Khwaja A, Rodriguez-Viciana P, Wennstrom S, Warne PH, Downward J. Matrix adhesion and Ras transformation both activate a phosphoinositide 3-OH kinase and protein kinase B/Akt cellular survival pathway. EMBO J. 1997;16:2783–2793. - PMC - PubMed
    1. Douma S, Van Laar T, Zevenhoven J, Meuwissen R, Van Garderen E, Peeper DS. Suppression of anoikis and induction of metastasis by the neurotrophic receptor TrkB. Nature. 2004;430:1034–1039. - PubMed
    1. Reginato MJ, Mills KR, Paulus JK, Lynch DK, Sgroi DC, Debnath J, et al. Integrins and EGFR coordinately regulate the pro-apoptotic protein Bim to prevent anoikis. Nat Cell Biol. 2003;5:733–740. - PubMed

Publication types

MeSH terms