. 2011 Sep 12:5:51.
doi: 10.3389/fnint.2011.00051. eCollection 2011.

Perceived duration of Visual and Tactile Stimuli Depends on Perceived Speed

Affiliations

Perceived duration of Visual and Tactile Stimuli Depends on Perceived Speed

Alice Tomassini et al. Front Integr Neurosci. .

Abstract

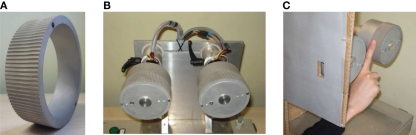
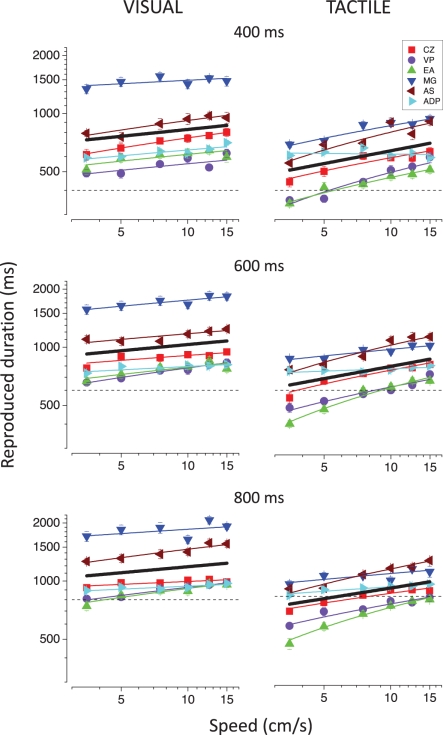
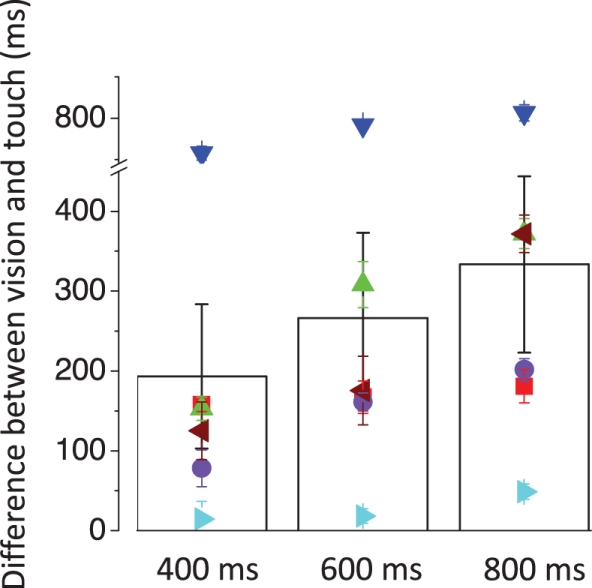
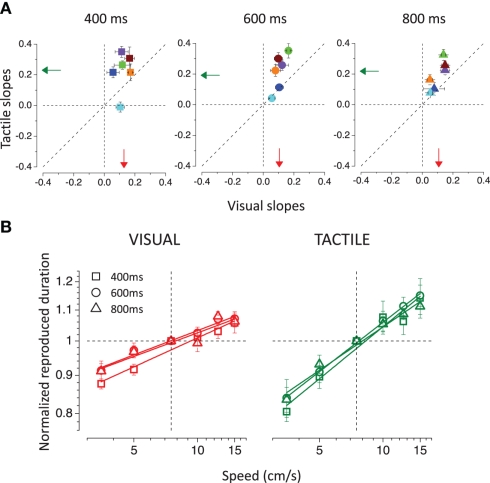
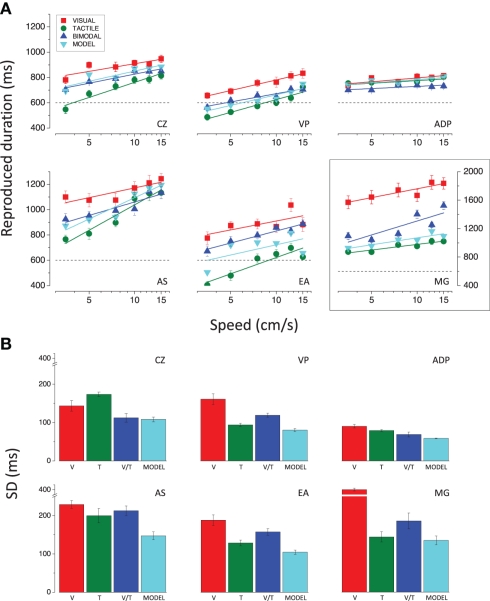
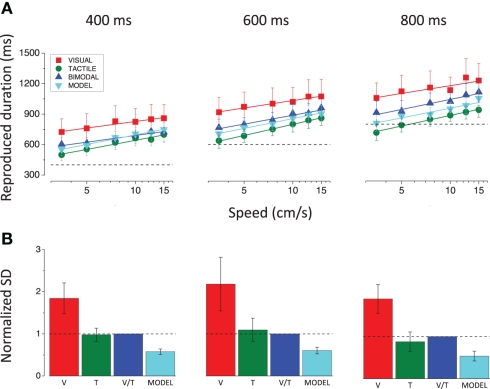
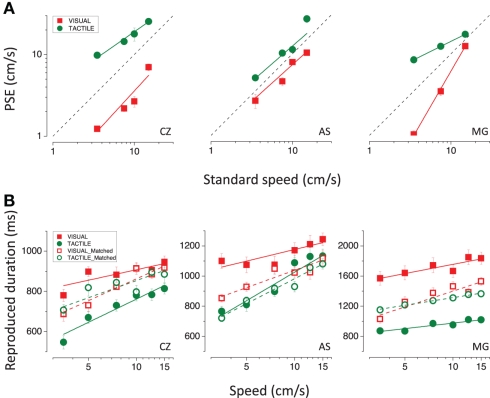
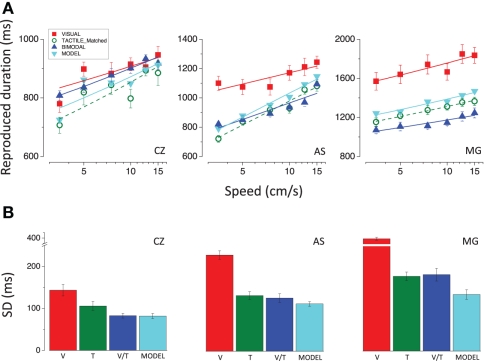
IT IS KNOWN THAT THE PERCEIVED DURATION OF VISUAL STIMULI IS STRONGLY INFLUENCED BY SPEED: faster moving stimuli appear to last longer. To test whether this is a general property of sensory systems we asked participants to reproduce the duration of visual and tactile gratings, and visuo-tactile gratings moving at a variable speed (3.5-15 cm/s) for three different durations (400, 600, and 800 ms). For both modalities, the apparent duration of the stimulus increased strongly with stimulus speed, more so for tactile than for visual stimuli. In addition, visual stimuli were perceived to last approximately 200 ms longer than tactile stimuli. The apparent duration of visuo-tactile stimuli lay between the unimodal estimates, as the Bayesian account predicts, but the bimodal precision of the reproduction did not show the theoretical improvement. A cross-modal speed-matching task revealed that visual stimuli were perceived to move faster than tactile stimuli. To test whether the large difference in the perceived duration of visual and tactile stimuli resulted from the difference in their perceived speed, we repeated the time reproduction task with visual and tactile stimuli matched in apparent speed. This reduced, but did not completely eliminate the difference in apparent duration. These results show that for both vision and touch, perceived duration depends on speed, pointing to common strategies of time perception.

Keywords: motion; multisensory integration; time perception; touch; vision.


Figures

Figure 1
Figure 1
Illustration of the stimuli. (A) Physical wheel etched with a sinewave profile of 3 c/cm. (B) Setup with two arms driven at specific speeds by independent computer-controlled motors. (C) In the visual condition subjects observed the front wheel in motion through a small window; in the tactile condition they touched with their right index finger the second wheel occluded to vision by a shield; in the bimodal condition they observed and touched the two wheels simultaneously.
Figure 2
Figure 2
Individual reproduced durations as a function of speed for the visual (left column) and the tactile (right column) stimuli. Different colors represent different subjects. The black solid lines represent the best-fitting linear functions for the average reproduced durations. The results for the 400, 600, and 800 ms durations are reported in the upper, middle, and lower panels, respectively. The dashed lines indicate the actual physical durations of the stimuli.
Figure 3
Figure 3
Difference between the reproduced durations for the visual and tactile stimuli as a function of stimulus duration. The symbols represent the individual data and the bars represent the averages across subjects.
Figure 4
Figure 4
(A) Tactile slopes plotted against visual slopes. The slopes were calculated, separately for each subject and condition, from the linear regression of the normalized reproduced durations (divided by the reproduced duration obtained for the 7.5-cm/s moving stimuli) as a function of speed. Different colors represent different subjects. The vertical and horizontal dashed lines indicate absence of dependence on speed, the diagonal shows equal dependence for vision and touch. The arrows show the averages for the visual (in red) and for the tactile (in green) conditions. (B) Normalized reproduced durations averaged across subjects are plotted as a function of speed for the visual (on the left) and tactile (on the right) stimuli. Different stimulus durations (400, 600, and 800 ms) are represented by different symbols.
Figure 5
Figure 5
(A) Reproduced durations for the 600 ms stimuli, plotted as a function of speed for all conditions. The results for the subject MG have been plotted on a different scale to encompass her wider range of duration estimates. (B) SDs of the reproduction averaged across speeds relative to the 600 ms visual (red bar), tactile (green bar), and bimodal (blue bar) stimuli and predicted for bimodal stimuli according to the Bayesian model (cyan bar); results for all subjects.
Figure 6
Figure 6
(A) Reproduced durations averaged across subjects, plotted as a function of speed, separately for the three stimulus durations (400, 600, and 800 ms). The dashed lines indicate the actual physical durations of the stimuli. (B) Average normalized SDs for all conditions and stimulus durations. The variances for all speeds and subjects were first divided by the bimodal variance, then summed and square-rooted to yield the SDs. The dashed lines show the normalized bimodal SDs.
Figure 7
Figure 7
(A) Point of subjective equalities for the visual (in red) and tactile (in green) stimuli as a function of tactile and visual standard speeds (3.5, 5, 7.5, 10, 12.5, 15 cm/s), respectively. The dashed line represents the equality line. (B) Reproduced durations plotted as a function of speed for the 600 ms visual (in red) and tactile (in green) moving stimuli. Filled symbols represent the results for the visual and tactile stimuli moving at the same physical speeds (standard speeds). Red open symbols represent the results for the visual stimuli matched in perceived speed to the tactile stimuli moving at the standard speeds (filled green symbols); green open symbols represent the results for the tactile stimuli matched in perceived speed to the visual stimuli moving at the standard speeds (filled red symbols); results for all subjects.
Figure 8
Figure 8
(A) Reproduced durations as a function of speed relative to the 600 ms stimuli. The green open symbols represent the reproduced durations for the tactile stimuli moving at the same perceived speed as the visual stimuli (red filled symbols). Blue symbols represent the results for the bimodal stimuli (visuo-tactile speed-matched stimuli) and the cyan symbols represent the results for the bimodal stimuli predicted according to Bayesian integration. (B) SDs of the reproduction averaged across speeds relative to the 600 ms visual (red bar), tactile (green bar), and bimodal (blue bar) stimuli and predicted for bimodal stimuli according to the Bayesian model (cyan bar); results for all subjects.

References

    1. Alais D., Burr D. (2004). The ventriloquist effect results from near-optimal bimodal integration. Curr. Biol. 14, 257–26210.1016/j.cub.2004.01.029 - DOI - PubMed
    1. Aschersleben G., Bertelson P. (2003). Temporal ventriloquism: crossmodal interaction on the time dimension 2. Evidence from sensorimotor synchronization. Int. J. Psychophysiol. 50, 157–16310.1016/S0167-8760(03)00131-4 - DOI - PubMed
    1. Bensmaia S. J., Killebrew J. H., Craig J. C. (2006). Influence of visual motion on tactile motion perception. J. Neurophysiol. 96, 1625–163710.1152/jn.00192.2006 - DOI - PMC - PubMed
    1. Bicchi A., Scilingo E. P., Ricciardi E., Pietrini P. (2008). Tactile flow explains haptic counterparts of common visual illusions. Brain Res. Bull. 75, 737–74110.1016/j.brainresbull.2008.01.011 - DOI - PubMed
    1. Bresciani J. P., Ernst M. O., Drewing K., Bouyer G., Maury V., Kheddar A. (2005). Feeling what you hear: auditory signals can modulate tactile tap perception. Exp. Brain Res. 162, 172–18010.1007/s00221-004-2128-2 - DOI - PubMed