

doi: 10.1021/cr200280p.
Epub 2011 Sep 26.
MALDI imaging of lipid biochemistry in tissues by mass spectrometry
Affiliations
- PMID: 21942646
- PMCID: PMC3199966
- DOI: 10.1021/cr200280p
Item in Clipboard
MALDI imaging of lipid biochemistry in tissues by mass spectrometry
Chem Rev.
.
No abstract available
Figures
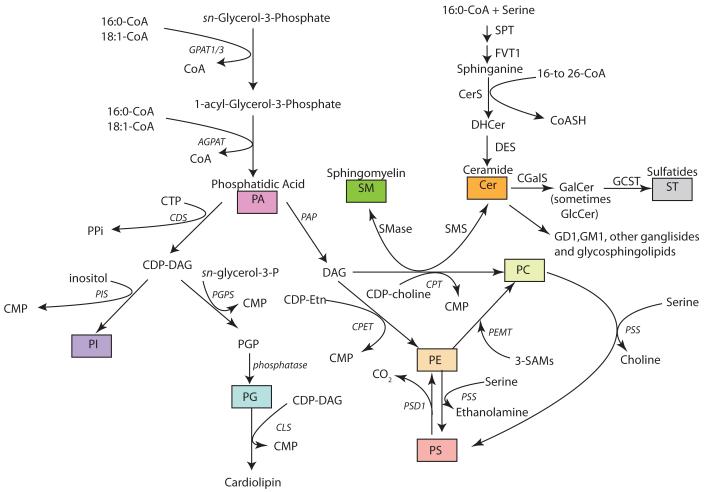
Schematic biosynthetic pathways for the major phospholipid (Kennedy Pathway) and sphingolipid classes biosynthesized in mammalian cells and observed in MALDI IMS of mammalian tissues. The lipids in the boxes are the major lipid species that generate either positive or negative ions. Each class is populated with individual molecular species. Abbreviations of lipid classes follow the Lipid Maps suggested abbreviations. Abbreviations of enzymes indicated in the pathways are as follows: GPAT1/3 - glycerol-3-P acyl transferase; AGPAT - acylglycerol-3-P acyl transferase; CDS - CDP-DAG synthase; PAP - Phosphatidic acid phosphatase; CPT - CDP-choline:1,2-diacylglycerol cholinephosphotransferase; PIS - PI synthase; SAMs - S-adenosylmethionine; CPET- CDP-Etn:1,2-diacylglycerol ethanolaminephosphotransferase; PSD1/2 - phosphatidylserine decarboxylase isoforms; CLS - cardiolipin synthase; PGPS- PG-P synthase; PSS - Phosphatidylserine synthase isoforms; PEMT - Phosphatidylethanolamine N-methyltransferase; GCST - GalCer sulfotransferase; CGlcS - glucosyl ceramide synthase; FVT1 - 3-ketosphinganine reductase; DES - dihydroceramide desaturase; PAPS - phosphoadenosine phosphosulfate; CGalS - galactosyl ceramide synthase; SMS - sphingomylelin synthase; SMase – sphingomylenase; CerS - dihydroceramide synthase; and SPT - serine palmitoyl transferase
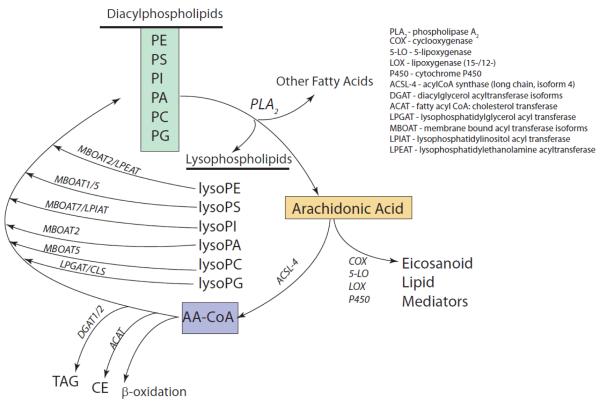
Remodeling of fatty acyl groups of common glycerophospholipids using arachidonic acid as an example of the modified Lands’ pathway responsible for diversity of phospholipid molecular species observed in MALDI IMS of tissues. Arachidonic acid released from phospholipids by phospholipase A2 (PLA2) is primarily converted into arachidonoyl CoA thioester. A small fraction of free arachidonic acid is available for lipid mediator biosynthesis into eicosanoids. The arachidonoyl CoA is substrate for transferases to re-esterify neutral lipids back into phospholipids by acylation of lysophospholipids. Other acyltransferases may be involved in addition to those indicated. Arachidonate degradation by β-oxidation proceeds by the CoA ester intermediate.
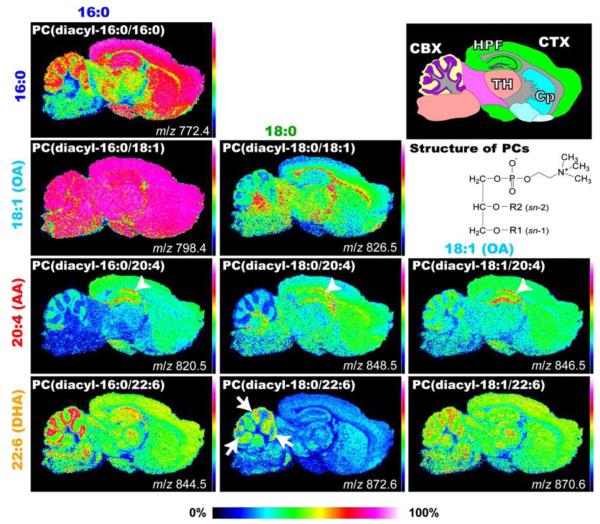
Differential distribution of PC molecular species in sagittal mouse brain sections. MALDI-IMS spectra of a brain section simultaneously identified the heterogeneous distributions of several PCs. Schema of the mouse brain sagittal section and ion images of PCs obtained by IMS are shown. Ion images of PCs are arranged according to their fatty acid (FA) composition. PCs with identical FA compositions at the sn-1 position are arranged lengthwise, whereas those with identical FA compositions at the sn-2 position are arranged sideways. The structures of PCs are also presented. Among the PCs, arachidonic acid-PCs showed characteristic localization in the hippocampal cell layers (arrowheads). Among docosahexaenoic acid-containing species, two abundant species, PC(16:0/22:6) and PC(18:1/22:6), were commonly enriched in the granule layer of the cerebellum, whereas PC(18:0/22:6) showed a characteristic dotted distribution pattern near the cell layer (arrows). CBX, cerebellar cortex; CP, corpus striatum; CTX, cerebral cortex; HPF, hippocampal formation; TH, thalamus. Reprinted with permission from Reference 156. Copyright 2009 the American Society for Biochemistry and Molecular Biology.
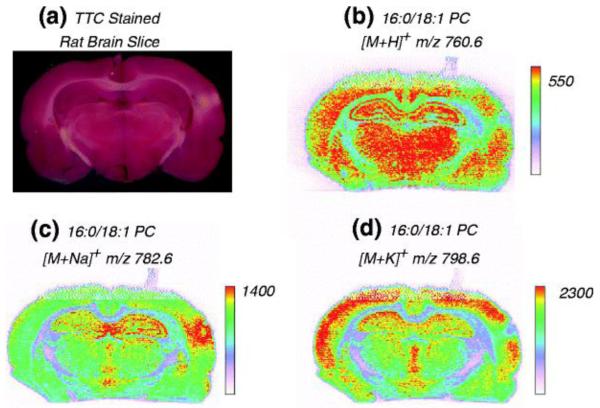
Rat brain sections from traumatic brain injury (TBI) model. (a) Tissue section stained with 2,3,5-triphenyl tetrazolium chloride (TTC); (b) MALDI IMS representing PC(16:0/18:1) [M + H]+ m/z 760.6; (c) MALDI IMS representing PC(16:0/18:1) [M + Na]+ m/z 782.6; (d) MALDI IMS representing PC(16:0/18:1) [M + K]+ m/z 798.6 . Reprinted with permission from Reference 76. Copyright 2011 American Society for Mass Spectrometry.
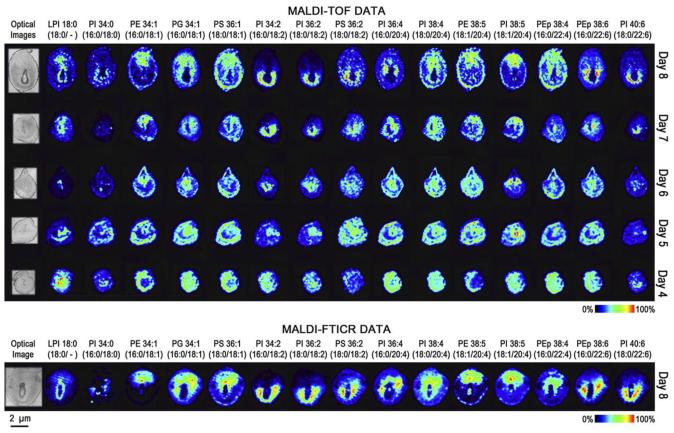
Molecular images of PE, PEp, PI, lysophosphatidylinositol (LPI), PS, and PG on days 4–8 of implantation. MALDI-TOF images (top) and MALDI-FTICR images (bottom) of implantation sites are located to the right of their respective optical images. Each column represents a unique phospholipid [M−H]−, and each row represents a different day of pregnancy. Each image is orientated so the M pole is at the top and the AM pole is at the bottom. Reprinted with permission from Reference 39. Copyright 2009 the American Society for Biochemistry and Molecular Biology.
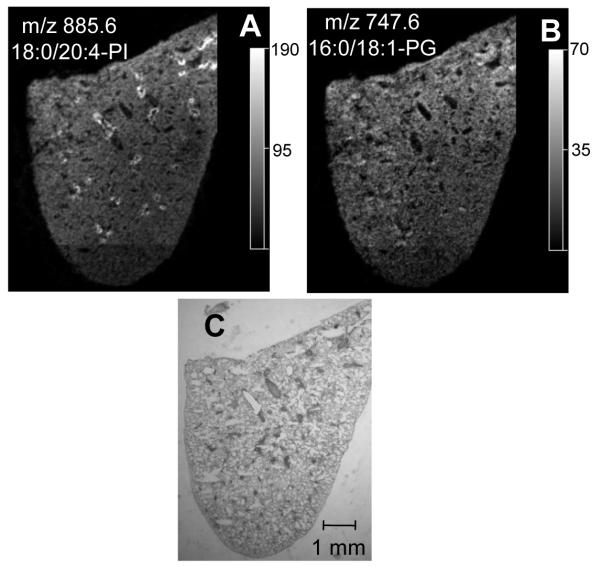
The localization of phosphatidylglycerol and phosphatidylinositol lipids in lung tissue. Extracted negative ion MALDI images of (A) PI(18:0/20:4) at m/z 885. and (B) 6 PG(16:0/18:1) at m/z 747.6 from a section a mouse lung. (C) Modified Giemsa stain of the same lung after MALDI imaging. Reprinted with permission from Reference 88. Copyright 2011 the American Society for Biochemistry and Molecular Biology.
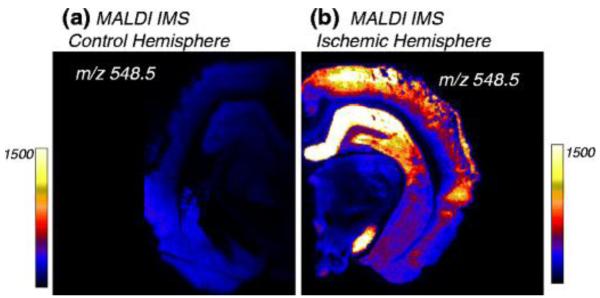
MALDI IMS representing m/z 548.5 ([M + H – H2O]+, Cer(d18:0/18:1)) in rat brain from (a) single hemisphere of control animal; (b) single hemisphere of animal subjected to bilateral ischemia . Reprinted with permission from Reference 76. Copyright 2011 American Society for Mass Spectrometry.
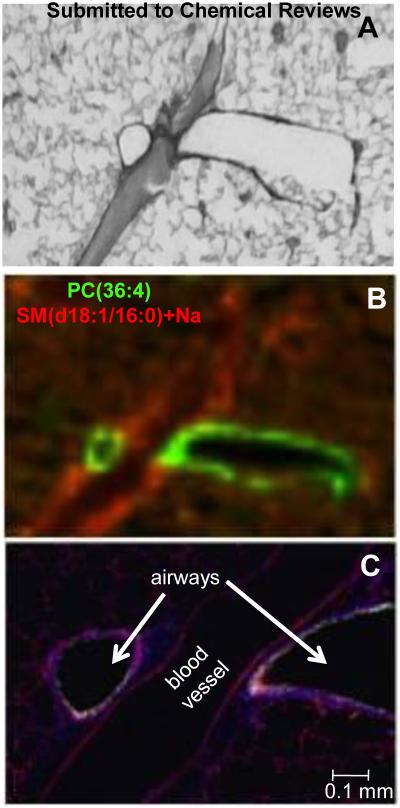
The anatomical structures in the lung were unequivocally identified by dual immunofluorescence and compared to the MALDI images. (A) Enlargement of the boxed part of the modified Giemsa stain of a section of a mouse lung that was inflated and embedded with modified optimal cutting temperature compound. (B) Merged positive ion MALDI image of PC(36:4) (green) and SM(d18:1/16:0)+Na (red). (C) Adjacent tissue section illustrating the localization of airways by acetylated tubulin (ACT, green), blood vessels by thrombomodulin (TM, red) and cell nuclei by DAPI (blue). Reprinted with permission from Reference 88. Copyright 2010 the American Society for Biochemistry and Molecular Biology.
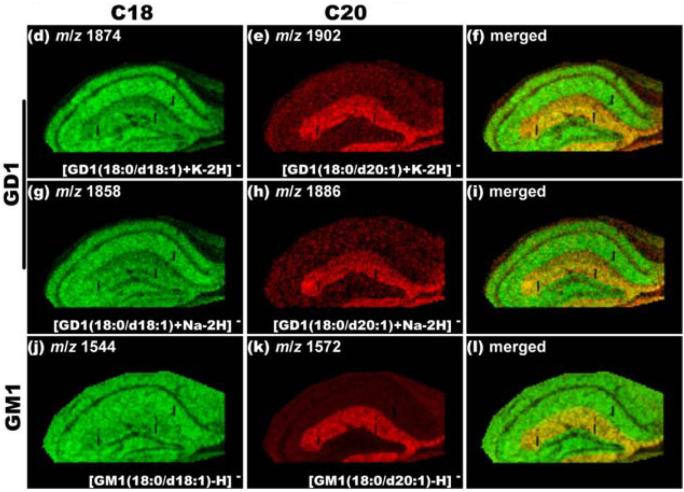
MALDI IMS (negative ion) of gangliosides in mouse hippocampus. The C20 ganglioside (GD1 18:0/d20:1) had greater intensity of the ion m/z 1902 [M+K-2H]− ion in the specstratum lacunosum moleculare (SLM), relative to the C18 ganglioside (GD1 18:0/d18:1). The structural differences between C20 and C18 gangliosides were due to carbon chain length differences at the membrane bound ceramide backbone, and not at the cytosolic carbohydrate portion of the molecules. This regional distinctiveness was apparent also for the C20 and C18 GM1 gangliosides. This research was originally published as Reference 127, as an open access article.
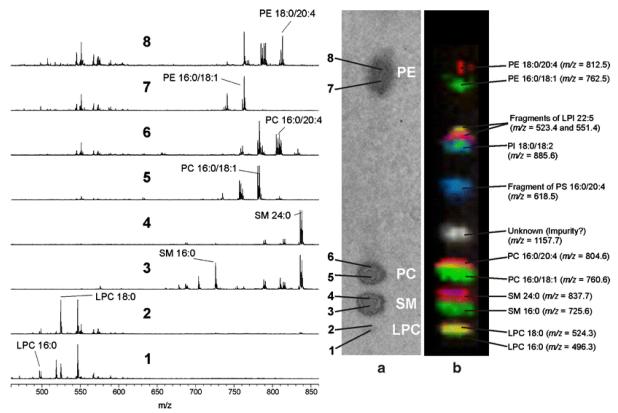
Photographic image of a typical HPTLC plate of an organic erythrocyte extract (a) and the corresponding MALDI image (b). Mass spectra (left) were recorded from spots subsequent to primuline staining. Only the most intense peaks showing a significant position dependence are annotated in the mass spectra. In the MALDI image recorded subsequent to automatic matrix application, additional classes of phosphplipids (e.g. PI) were detected that were not detectable by primuline staining. The structure corresponding to m/z=1157.7 could not be yet assigned. Reprinted with permission from Reference 140. Copyright 2008 Springer.
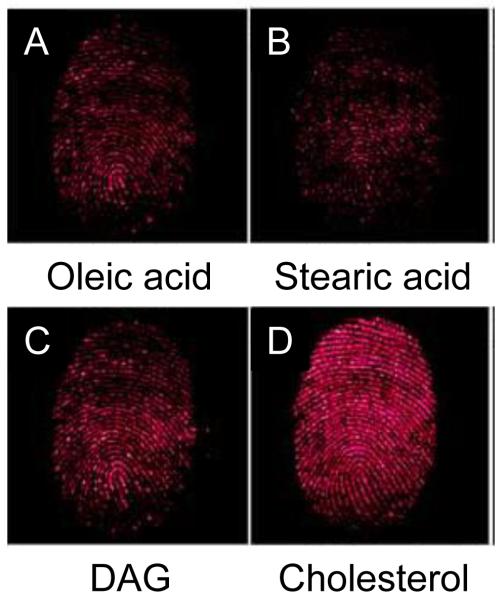
MALDI-MSI analysis of an ungroomed, fresh fingermark. (a) Fingermark MS image reconstructed from the ion signal at m/z 283 (oleic acid), (b) m/z 285, (stearic acid), (c) m/z 669.6 (diacylglycerol), and (d) m/z 369 (cholesterol). Modified from the original figure. Reprinted with permission from Reference 144. Copyright 2009 John Wiley.
References
-
- Fahy E, Subramaniam S, Brown HA, Glass CK, Merrill AH, Jr., Murphy RC, Raetz CRH, Russell DW, Seyama Y, Shaw W, Shimizu T, Spener F, van Meer G, VanNieuwenhze MS, White SH, Witztum JL, Dennis EA. J. Lipid Res. 2005;46:839. - PubMed
-
- Touboul D, Brunelle A, Laprevote O. Biochimie. 2011;93:113. - PubMed
-
- Stauber J, MacAleese L, Franck J, Claude E, Snel M, Kaletas BK, Wiel IM, Wisztorski M, Fournier I, Heeren RM. J. Am. Soc. Mass Spectrom. 2010;21:338. - PubMed
Publication types
MeSH terms
Substances
Grants and funding
LinkOut - more resources
Full Text Sources
Other Literature Sources
