

Review
doi: 10.1021/cr2002992.
Epub 2011 Sep 27.
Enzymes of the cyclooxygenase pathways of prostanoid biosynthesis
Affiliations
- PMID: 21942677
- PMCID: PMC3285496
- DOI: 10.1021/cr2002992
Item in Clipboard
Review
Enzymes of the cyclooxygenase pathways of prostanoid biosynthesis
Chem Rev.
.
No abstract available
Figures

Generally, a given cell type forms only one or two of these products in abundance. For example, circulating human platelets form primarily thromboxanes. Abbreviations include: cPLA2, cytosolic phospholipase A2; sPLA2, nonpancreatic, secretory phospholipase A2; PG, prostaglandin; PGHS, prostaglandin endoperoxide H synthase; COX, cyclooxygenase; POX, peroxidase; H-PGDS, hematopoietic PGD synthase; L-PGDS, lipocalin-type PGD synthase; cPGES, cytosolic PGE synthase; mPGES-1, microsomal PGE synthase-1; PGFS, PGF synthase; PGIS, PGI (prostacyclin) synthase; TXAS, TxA synthase. DP1, DP2, EP1, EP2, EP3, EP4, FP, IP and TP are designations for the G protein linked PG receptors. Reprinted with permission from Reference ; copyright 2008 Elsevier.

Numbering of PGHSs utilizes the sequence of ovPGHS-1 as a reference for alignment. For ovPGHS-1 the signal peptide is shown in yellow, the EGF-like domain is shown in green and the membrane binding domain with its four helices is shown in cyan. Numbering of ovPGHS-1 from 1-600 begins with the Met at the translation start site. Ala-25 is the N-terminal residue of the mature protein. Beginning with Phe-107 all of the sequences are appropriately aligned until approximately residue 584. Immediately upstream of Phe-107, there is an additional residue in PGHS-2. In addition the signal peptides differ in lengths. Finally, PGHS-2 contains eight more residues at the C-terminus than PGHS-1. The net result is that mature forms of PGHS-1 contain 576 residues while mature forms of PGHS-2 contains 587 residues. Immediately upstream of the C-terminal ER-retention signal STEL, which is highlighted in brown, PGHS-2 contains an 19 amino acid sequence (underlined) that contains Asn-594, a consensus glycosylation site unique to PGHS-2; the 27-amino acid instability motif (27-AA IM) found near the C-terminus of PGHS-2 and shown in dark yellow includes this 19 amino acid insert. There are three N-glycosylation sites common to both isoforms including Asn-68, Asn-144 and Asn-410 shown in red. Some other important residues are also shown in red. Arg-120 is involved in interacting with the carboxyl group of fatty acid substrates, Tyr-385 is the tyrosyl residue involved in abstracting a hydrogen from the substrate fatty acid, His-388 is the proximal heme ligand at the POX active site, Tyr-504 is a tyrosine radical reservoir, and Ser-530 is the site of acetylation by aspirin. Cys-37 links the EGF-like domain to the catalytic domain via Cys-159. Ovine PGHS-1, NCBI Reference Sequence: NP_001009476.1; murine PGHS-1, NCBI Reference Sequence: NP_032995.1; human PGHS-1, NCBI Reference Sequence: NP_000953.2; human PGHS-2, NCBI Reference Sequence: NP_032995.1; murine PGHS-2, NCBI Reference Sequence: NP_035328.2.

Comparison of the domain structures and numbering of huPGHS-1 and huPGHS-2. Numbering is based on the ovPGHS-1 template noted in the text and the legend to Figure 2. The mature forms of huPGHS-1 and huPGHS-2 contain 576 and 587 residues, respectively. Both isoforms have a signal peptide (S), an epidermal growth factor (EGF)-like domain, a membrane-binding domain (MBD), and a catalytic domain. PGHS-2 has a shorter signal peptide (17 amino acids) than PGHS-1 (23 amino acids). The C-terminal STEL sequences of PGHS-1 and PGHS-2, respectively, are weak ER targeting signals. The asparagine N-glycosylation sites are shown; note the additional N-glycosylation site at Asn-594 in PGHS-2. Arg-120, Tyr-385 and His-388 are important in catalysis. Tyr-504 can serve as a reservoir for the tyrosine radical. Ser-530 is the aspirin acetylation site. The amino acid sequence of the 27 amino acid instability motif (IM) comprising residues 586-612 is shown.

Ribbon diagrams of (A) ovPGHS dimer with flurbiprofen bound in the COX active sites (PDB 1CQE). (B) Monomer of the structure in (A). Epidermal growth factor (EGF) domains in green; membrane binding domains (MBD) in cyan; catalytic domains in dark and light blue; heme groups at the POX active sites are shown in red; carbohydrate groups (N-acetyl-glucosamines) are in black/gray; flurbiprofen in yellow.

(A) Removal of the 13-proS hydrogen atom from AA by a Tyr385 radical to form an arachidonyl radical. (B) Addition of O2 to C-11 to form an 11-hydroperoxyl radical. (C) Reaction of the 11-hydroperoxyl radical to form an endoperoxide with a carbon-centered radical at C-8. (D) Cyclization (C-8 to C-12 bond formation) to form a five membered ring and a carbon-centered radical on C-15. (E) Addition of a second O2 at C-15 and re-addition of the hydrogen atom abstracted in (A).

Ribbon diagram of region of ovPGHS-1 (in green) encompassing Arg-120 and Tyr-385 (both in magenta) and showing the relationship of Tyr-385 to C-13 (and the 13-proS hydrogen of arachidonic acid (AA) in yellow. The carboxyl end of AA is shown interacting with Arg-120.

A hydroperoxide oxidizes the heme group to an oxyferryl heme radical cation (Intermediate I) with concomitant formation of the corresponding alcohol. Intermediate I can undergo either intramolecular isomerization to form Intermediate II containing an oxyferryl heme and a tyrosine radical centered on Tyr385 or a one electron reduction to a Compound II-like species; Intermediate II and Compound II have the same UV-VIS heme spectrum. The Tyr385 radical can abstract the 13-proS hydrogen from AA to initiate COX catalysis. The POX and COX activities of PGHS-2 can undergo self-inactivation via different processes both of which appear to emanate from Intermediate II. Adapted from Reference with permission; copyright 2008 Elsevier.

Ecat is the catalytically functional monomer, which is regulated by the allosteric monomer Eallo. Heme binds Ecat but not Eallo with high affinity; in essence, heme binding to Ecat significantly reduces the affinity of heme for Eallo. It is not known whether heme binds randomly to equivalent monomer in forming the heterodimer or whether heme binds a transiently pre-existing Ecat/Eallo dimer. AA binds to both Eallo and Ecat although it has a higher affinity for Eallo (see Figure 9). PA also has a higher affinity for Eallo. Some inhibitors (e.g. naproxen and ibuprofen) bind Eallo with higher affinity than Ecat whereas, as shown, many inhibitors bind Ecat with higher affinity and compete directly with AA to inhibit COX activity. Adapted from Reference with permission; copyright 2011 American Society of Biochemistry and Molecular Biology.

(A) Binding of AA to Eallo and Ecat and its oxygenation by PGHS-2. (B) Binding of AA and its oxygenation by PGHS-2 in the presence of an excess of palmitic acid (PA). Adapted from Reference with permission; copyright 2011 American Society of Biochemistry and Molecular Biology.

(A) Time-dependent loss of COX activity observed when either PGHS-1 or PGHS-2 is pre-incubated with a time-dependent inhibitor. (B) Recovery of COX activity that occurs following time-dependent loss of activity.

(A) Representation of ibuprofen (or mefenamic acid) inhibition of 2-AG oxygenation by PGHS-2; in this example of time-independent allosteric inhibition, Eallo-I/Ecat-2-AG functions at only 25% of the rate of Eallo/Ecat-2-AG. This is a form of (B) Representation of ibuprofen (or mefenamic acid) inhibition of AA oxygenation by PGHS-2; in this example of time-independent inhibition, there is a modest allosteric inhibition (~15%) with both Eallo-I /Ecat-AA and Eallo- AA /Ecat-AA being active but functioning at slightly different rates., (C) Time-dependent, allosteric inhibition of PGHS-2 mediated AA oxygenation such as that seen with naproxen. In this situation *Eallo-I /Ecat is time-dependently inhibited and has relatively low but still appreciable COX activity. (D) Time-dependent inhibition by of AA oxygenation by PGHS-2 involving the binding of the inhibitor to Ecat. In this case, which is representative of what is seen with celecoxib, rofecoxib, indomethacin and diclofenac, *Eallo- AA /Ecat-I is a time dependently inhibited and completely inactive form of the enzyme.

Alternate conformations of residues 121–129 in one monomer at the interface with another monomer. The monomer shown with the residues in orange is a monomer of ovPGHS-1 to which celecoxib is bound. The sidechains of the other monomer occur in two conformations. One is from a monomer to which no celecoxib is bound (blue) and the other is from a monomer to which celecoxib is bound in the COX site (magenta). Reprinted with permission from Reference ; copyright 2010 National Academy of Sciences.

(A) The dimeric structure. (B) The Mg2+-binding site. (C) The Ca2+-binding site. (D) The monomeric structure. (E) Close-up view of the superimposed structures around the active site of H-PGDS in the presence (sky blue) and in the absence (gray) of HQL-79 shown as a space-filling model. GSH molecules in the presence (green carbon atoms) and absence (gray carbon atoms) of HQL-79 are also shown. (F) Schematic drawing of the binding mode of HQL-79. Hydrogen bonds and salt bridges are shown by yellow-dotted lines, weak hydrogen bonds by blue-dotted lines, and the coordinate bond for Mg2+ by the yellow arrow.

Several reaction models have been proposed for the conversion of PGH2 to PGD2. C-9 and C-11 substituents are omitted for clarity. B represents a base including a hydroxyl ion (OH-). Path A is hypothetical and Paths B and C seem plausible.

A schematic drawing of the catalytic pocket of H-PGDS with PGH2. Pockets 1, 2, and 3 are shaded. The thiolate anion of bound GSH attacks the oxygen at C11 of PGH2 (panel 2). The putative reaction intermediate of PGH2 with GSH is attacked by a certain base-like bulk GSH in solvent (panel 3) to produce PGD2 in a sterically restricted manner (panel 4). A GS- in step 3 of the reaction is accessible from the outside of the catalytic cleft of H-PGDS. Adapted from from Reference with permission; copyright 1997 Cell Press.

(A) NMR structure of mouse Δ1-24Cys89,186Ala L-PGDS. (B) The central cavity of L-PGDS. Inner accessible surface of the cavity with the polypeptide backbone is shown in gray. (C) X-ray crystallographic structure of mouse Δ1-24Cys65Ala L-PGDS. The conformational differences between the open and closed forms are colored in sky blue and pink, respectively, in the E-F loop. (D) Open and closed lids of the mouse L-PGDS cavity; E-F loop is shown in sky blue (open form) and pink (closed form). (E) X-ray crystallographic structure of human Δ1-28Cys65Ala L-PGDS bound with oleic acid (yellow) and palmitoleic acid (green).

Details of the various steps are presented in the text.

Thiol activation by hydrogen bond networks of L-PGDS, H-PGDS the σσσ class of GST, and the θθθ class of GST.

(A) Non-selective inhibitors (B) H-PGDS-selective inhibitors., (C) L-PGDS-selective inhibitor AT-56.

Structures of agonists and antagonists of DP1, DP2, and FP receptors.

Every 10th residue is underlined and the total numbers of residues are given for each protein. Conserved residues of the MAPEG superfamily are highlighted with red letters. Note that some of these residues are not conserved in FLAP, which is consistent with its lack of GSH binding and enzymatic activity. For mPGES-1 the positions of the four transmembrane helices are indicated and crucial residues located at the active site or important for structural integrity, respectively, are highlighted with blue or gray background. These residues are further discussed in the text and shown in detail in Figure 25. Adapted from Reference .

The COX activity of PGHSs forms PGG2. It has been demonstrated that mPGES-1 catalyses the intra-molecular oxido-reduction at similar rates regardless of the nature of the substituent at carbon 15, forming either PGE2 or 15-hydroperoxy-PGE2 which, if formed, is probably rapidly reduced into PGE2 either non-enzymatically or via various peroxidases.

The overall structures of microsomal PGES-1 (mPGES-1), microsomal glutathione-S-transferase-1 (MGST1), leukotriene C4 synthase (LTC4S) and 5-lipoxygenase activating protein (FLAP) are compared. Each monomer of the trimeric proteins is represented with a unique color with its N- and C-terminals facing downwards and cytosolic loops facing upwards. Membrane boundaries are indicated with horizontal lines. The four transmembrane helices are shown with GSH occupying the space between subunits 1 and 4 of mPGES-1, MGST1 and LTC4S. In FLAP, the corresponding space is occupied by the inhibitor MK-591. GSH and MK-591 are depicted in spherical models with carbon atoms colored yellow. Note that in MGST1 GSH adopts an elongated conformation while it is more condensed in mPGES-1 and LTC4S. Structures and in parenthesis PDB ID numbers are MPGES1 (3DWW), MGST1 (2H8A), LTC4S (2UUI), FLAP (2Q7M).

The mechanism could involve either a thiol attack by via a glutathione peroxidase like mechanism, or alternatively, the reaction could occur via acid-base catalysis.

(A) The human mPGES-1 homotrimer in an open configuration. Monomers are colored green, gray, and white, respectively. GSH is depicted in a stick representation with its carbon atoms colored in yellow. (B) The inhibitor binding site as observed via the V-shaped cleft between subunits 4 and 1 of neighboring monomers (colored in green and gray, respectively). Residues Thr-131, Leu-135, and Ala-138 (in stick representation with carbon atoms colored in dark blue) corresponding to Val-131, Phe-135, and Phe-138 in rat mPGES-1 together account for the major differences in inhibitor efficacies. Arg-126 (in stick representation with carbon atoms colored in light blue) is suggested to be the catalytic residue lowering the pKa of the glutathione sulfhydryl group. (C) The residues that function in subunit stabilization between TM2 and TM3, Arg-110 (in stick representation with carbon atoms colored in orange) makes polar contacts to residues Asn-74, Glu-77, and Thr-78 (all in stick representation with carbon atoms colored in magenta) as well as to GSH (in stick representation with carbon atoms colored in yellow). (D) The same part of the protein as in the upper right but rotated 180°.

AKR, aldo-keto reductase.

Reaction scheme for prosamide/PGFS activity of the thioredoxin system.

(A) AKR1C3 bound with NADP+ and PGD2 and (B) with NADPH and rutin. The α-helices and β-strands in the α/β base are colored aquamarine and magenta, respectively. The loops are shown in yellow and labeled with numbers. The bound NADP+/NADPH and PGD2/rutin are colored cyan and light pink, respectively. (C) The possible hydrogen bond donors and acceptors. Distances between atoms are noted in black in (C).

(A) In this structure PGH2 has been docked in the catalytic site using a molecular simulation program. AKR1B1 (green), NADP+ (yellow), the substrate, PGH2 (orange), Tyr-48 (purple), Asp-43 (green), Lys-77 (cyan) and His-110 (magenta). The hypothetical catalytic mechanisms of PGDS (B) and PGFS (C) activities of AKR1B1 in the absence and the presence of NADPH, respectively. In the absence of NADPH, the concerted reaction of Asp-43, Lys-77 and His-110 increases the basicity of His-110 and extracts the proton C-11 of PGH2. Another proton is provided to the O-9 atom of PGH2 from an unidentified proton donor (EnzA-H) to produce PGD2. However, in the presence of NADPH, the hydride ion is transferred from NADPH to the O-9 atom of the peroxide oxygen of PGH2, and a proton is provided from His-110 to O-11 to produce PGF2a. In the presence of NADP+, Asp-43 forms a hydrogen bond with NADP+ and disrupts the catalytic triad, which is essential for the production of PGD2. However, the function of Tyr-48 is not clear at present. C-9 and C-11 chiralities of PGH2 have been corrected from Reference .

(A, left) The overall structure of TbPGFS with bound NADP+, showing the overall structure viewed down the COOH-terminal end of the central β-barrel with the NADP+ molecule drawn in ball-and-stick model. The α-helices (in blue) and β-sheets (in yellow) are separated among them by loops (in orange). One citrate molecule is also depicted as a ball-and-stick model within the putative catalytic cleft. (A, right) Side view of the overall structure of TbPGFS_NADP+_citrate ternary complex (in light blue), in which the extended loops (β1-α1, β4-α4, and β7-H1) in other AKRs are absent in TbPGFS. (B) Proposed catalytic mechanism for the enzymatic reduction of PGH2. When a substrate binds to the active site of TbPGFS, a NADPH hydride attacks the C-9 carbonyl of PGH2, whereas a proton from His-110 will be transferred to the negatively charged C-11 carbonyl. Lys77 appears to have a role of maintaining the position of His-110 and stabilizing Asp-47. C-9 and C-11 chiralities of PGH2 have been corrected from those in Reference .
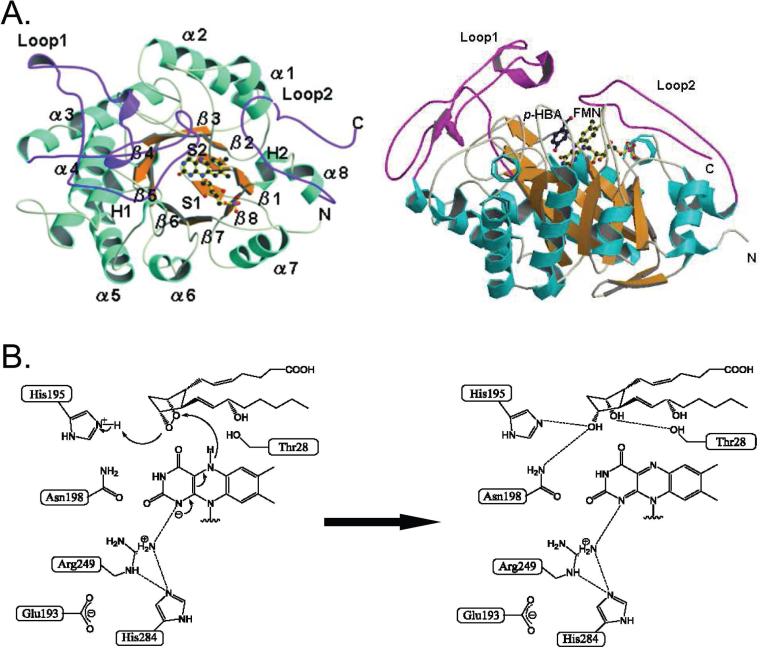
(A) In the TcOYE structure, the α-helices (cyan) and β-sheets (orange) are separated by loops (light yellow). Loop 1 and Loop 2 are shown in magenta. FMN is shown as a ball-and-stick model. (B) Proposed catalytic mechanism for the enzymatic reduction of PGH2. A hydride is expected to be transferred from N-5 of FMN to C-9 oxygen of PGH2, whereas a proton would be from His-195 to C-11 oxygen of PGH2.
References
Publication types
MeSH terms
Substances
Grants and funding
LinkOut - more resources
Full Text Sources
Other Literature Sources
