. 2011 Sep 25:5:148.
doi: 10.1186/1752-0509-5-148.

How yeast re-programmes its transcriptional profile in response to different nutrient impulses

Affiliations

How yeast re-programmes its transcriptional profile in response to different nutrient impulses

Duygu Dikicioglu et al. BMC Syst Biol. .

Abstract

Background: A microorganism is able to adapt to changes in its physicochemical or nutritional environment and this is crucial for its survival. The yeast, Saccharomyces cerevisiae, has developed mechanisms to respond to such environmental changes in a rapid and effective manner; such responses may demand a widespread re-programming of gene activity. The dynamics of the re-organization of the cellular activities of S. cerevisiae in response to the sudden and transient removal of either carbon or nitrogen limitation has been studied by following both the short- and long-term changes in yeast's transcriptomic profiles.

Results: The study, which spans timescales from seconds to hours, has revealed the hierarchy of metabolic and genetic regulatory switches that allow yeast to adapt to, and recover from, a pulse of a previously limiting nutrient. At the transcriptome level, a glucose impulse evoked significant changes in the expression of genes concerned with glycolysis, carboxylic acid metabolism, oxidative phosphorylation, and nucleic acid and sulphur metabolism. In ammonium-limited cultures, an ammonium impulse resulted in the significant changes in the expression of genes involved in nitrogen metabolism and ion transport. Although both perturbations evoked significant changes in the expression of genes involved in the machinery and process of protein synthesis, the transcriptomic response was delayed and less complex in the case of an ammonium impulse. Analysis of the regulatory events by two different system-level, network-based approaches provided further information about dynamic organization of yeast cells as a response to a nutritional change.

Conclusions: The study provided important information on the temporal organization of transcriptomic organization and underlying regulatory events as a response to both carbon and nitrogen impulse. It has also revealed the importance of a long-term dynamic analysis of the response to the relaxation of a nutritional limitation to understand the molecular basis of the cells' dynamic behaviour.


Figures

Figure 1
Figure 1
Correlation analysis of genome-wide transcriptional response. Each data point corresponds, on the x-axis, to samples collected at 20 sec, 40 sec, 60 sec, 8 min, 16 min, 24 min, 32 min, 1 hr, 2 hr, 3 hr, 4 hr, 5 hr, 7 hr, 2nd steady state after release from the nutrient limitation represented by the 1st steady state. The y-axis corresponds to the measure of correlation between the specific time point indicated in the x-axis and the 1st steady state using Pearson correlation as the distance metric.
Figure 2
Figure 2
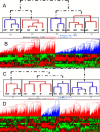
Hierarchical clustering of the dynamics of liberation from glucose limitation (A, B) and from ammonia limitation (C, D). The clustering of the time points (A) and the genes (B) for carbon catabolite repression and the clustering of the time points (C) and the genes (D) for nitrogen catabolite repression are presented from top to bottom of the Figure. The clustering of the genes resulted in two major clusters (B) in the case of carbon catabolite repression (indicated in red and blue) and three major clusters (D) in the case of nitrogen catabolite repression; a similarity distance of 0.5 was used as the threshold. with the selected distance metric, as the Pearson correlation coefficient. The individual time points in the dynamic scale arranged into clusters forming distinct phases in which the transcriptome response was observed to be similar.
Figure 3
Figure 3
Dilution of pulse. Changes in the concentration of the limiting nutrient supplemented by an impulse in the chemostat as modelled by an ordinary differential equation. The cellular uptake of the nutrient for cellular growth and maintenance requirements was excluded from the model. The actual dynamics of the biomass concentration within the growth vessel is also provided. Two different scales are used on the y-axis for biomass and nutrient concentrations.
Figure 4
Figure 4
Clustering of Significantly Expressed Transcripts in Glucose (A) or Ammonium (B) Perturbations. The self-organization of the dynamic response of the differentially expressed transcripts around a 2 × 4 arrangement of 8 imaginary points in space in the case of carbon catabolite repression and a 3 × 3 arrangement of 9 imaginary points in space in the case of nitrogen catabolite repression are presented. The cluster number is indicated in the top left corner of each cell. The number of genes in each cluster, which is formed around the imaginary points in space with an acceptable confidence interval, is indicated in the top centre and each red square represents a time point. The blue and yellow curves represent the confidence interval around the centroids.
Figure 5
Figure 5
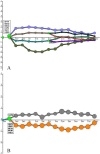
Identification of bifurcation points in the case of carbon catabolite repression (A), or nitrogen catabolite repression (B). Dynamic regulatory map based on time-series gene expression data and interaction data that associates transcription factors with the genes they regulate, highlighting bifurcation events in the time series. Transcription factors selectively responsible for the regulation a certain subset of genes causing these bifurcations are also shown in the Figure. Each time point on the x-axis corresponds to the 1st steady state, 20 sec, 40 sec, 60 sec, 8 min, 16 min, 24 min, 32 min, 1 hr, 2 hr, 3 hr, 4 hr, 5 hr, 7 hr post-impulse and the 2nd steady state attained following release from limitation. The major paths and splits in the time series data were constructed by the genes that are assigned to these paths through the model. Each node is associated with a Gaussian distribution determining its y-axis location on the map. The area of a node is proportional to the standard deviation from the Gaussian distribution. A relatively small node implied the expression of the genes going through that node will be tightly centered around the node. Bright green nodes represent split nodes, from which multiple paths diverge.
Figure 6
Figure 6
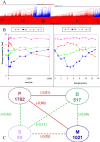
Investigation of the C-NP network. The modules P, M, S and D as determined by hierarchical clustering taking inter-cluster anti-correlated links into consideration (A), average dynamic expression profiles of the clusters (B), average inter-modular PCC values (C). The nodes in (C) indicate the modules with the number of genes in each module presented in the nodes. The edges indicate correlation (green dashed) and anti-correlation (red solid); the correlation coefficients are provided in parentheses.
Figure 7
Figure 7
General Scheme of Fermentation. Following the inoculation of the fermentation medium, ca. 5 residence times elapsed before the culture reached steady state and 5 residence times were spent at steady state prior to sampling. Following the impulse, the fermentation medium is first diluted and then recovered in ca. 50 hours. The second steady sample was collected after the chemostat spent 5 residence times at steady state.

References

    1. Shin DY, Matsumoto K, Iida H, Uno I, Ishikawa T. Heat shock response of Saccharomyces cerevisiae mutants altered in cyclic AMP-dependent protein phosphorylation. Mol Cell Biol. 1987;7(1):244–250. - PMC - PubMed
    1. Viladevall L, Serrano R, Ruiz A, Domenech G, Giraldo J, Barcelo A, Arino J. Characterization of the Calcium-mediated response to alkaline stress in Saccharomyces cerevisiae. J Biol Chem. 2004;279(42):43614–43624. doi: 10.1074/jbc.M403606200. - DOI - PubMed
    1. Kresnowati MTAP, van Winden WA, Almering MJH, ten Pierick A, Ras C, Knijnenburg TA, Daran-Lapujade P, Pronk JT, Heijnen JJ, Daran JM. When transcriptome meets metabolome: fast cellular responses of yeast to sudden relief of glucose limitation. Mol Syst Biol. 2006;2:49. - PMC - PubMed
    1. Ronen M, Botstein D. Transcriptional response of steady-state yeast cultures to transient perturbations in carbon source. P Natl Acad Sci USA. 2006;103(2):389–394. doi: 10.1073/pnas.0509978103. - DOI - PMC - PubMed
    1. Causton HC, Ren B, Koh SS, Harbison CT, Kanin E, Jennings EG, Lee TI, True HL, Lander ES, Young RA. Remodelling of yeast genome expression in response to environmental changes. Mol Biol Cell. 2001;12:323–337. - PMC - PubMed

Publication types

MeSH terms

LinkOut - more resources