. 2011 Sep 25:5:149.
doi: 10.1186/1752-0509-5-149.

In vivo kinetics of transcription initiation of the lar promoter in Escherichia coli. Evidence for a sequential mechanism with two rate-limiting steps

Affiliations

In vivo kinetics of transcription initiation of the lar promoter in Escherichia coli. Evidence for a sequential mechanism with two rate-limiting steps

Meenakshisundaram Kandhavelu et al. BMC Syst Biol. .

Abstract

Background: In Escherichia coli the mean and cell-to-cell diversity in RNA numbers of different genes vary widely. This is likely due to different kinetics of transcription initiation, a complex process with multiple rate-limiting steps that affect RNA production.

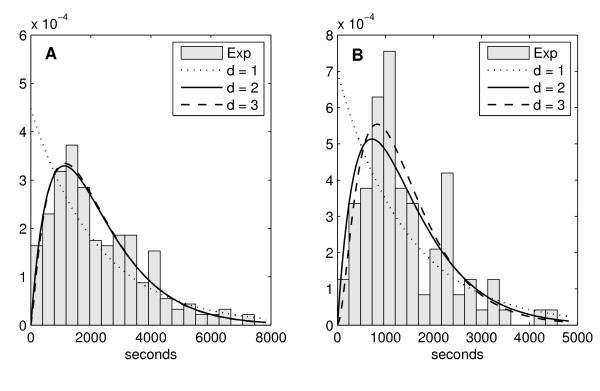
Results: We measured the in vivo kinetics of production of individual RNA molecules under the control of the lar promoter in E. coli. From the analysis of the distributions of intervals between transcription events in the regimes of weak and medium induction, we find that the process of transcription initiation of this promoter involves a sequential mechanism with two main rate-limiting steps, each lasting hundreds of seconds. Both steps become faster with increasing induction by IPTG and Arabinose.

Conclusions: The two rate-limiting steps in initiation are found to be important regulators of the dynamics of RNA production under the control of the lar promoter in the regimes of weak and medium induction. Variability in the intervals between consecutive RNA productions is much lower than if there was only one rate-limiting step with a duration following an exponential distribution. The methodology proposed here to analyze the in vivo dynamics of transcription may be applicable at a genome-wide scale and provide valuable insight into the dynamics of prokaryotic genetic networks.


Figures

Figure 1
Figure 1
Histogram of the measured intervals superimposed with the probability density functions of the models. Distributions of intervals between consecutive transcription events for weak (left) and medium (right) inductions. Each bar is 180 s. Measurement time is 2 hours (measured every 60 s). (A) mean of measured intervals is 2233 s and standard deviation is 1506 s (data from 233 intervals extracted from 283 cells). (B) mean of measured intervals is 1433 s and standard deviation is 1243 s (data from 99 intervals extracted from 40 cells). The histograms of measured intervals are superimposed with probability density functions of models with 1, 2 and 3 steps that best fit the data. Dotted line: 1-step model, solid line: 2-step model and dashed line: 3-step model (partially covered by solid line).
Figure 2
Figure 2
MS2d-GFP-tagged RNA molecules in E. coli cells. Unprocessed image of MS2d-GFP-tagged RNA molecules in E. coli cells (left) and the corresponding segmented image showing detected cells (grey) and MS2d-GFP-RNA spots (white) within (right).

References

    1. Taniguchi Y, Choi PJ, Li GW, Chen H, Babu M, Hearn J, Emili A, Xie XS. Quantifying E. coli Proteome and Transcriptome with Single-Molecule Sensitivity in Single Cells. Science. 2010;329:533–538. doi: 10.1126/science.1188308. - DOI - PMC - PubMed
    1. Choi PJ, Xie XS, Shakhnovich EI. Stochastic Switching in Gene Networks Can Occur by a Single-Molecule Event or Many Molecular Steps. J Mol Biol. 2010;396:230–244. doi: 10.1016/j.jmb.2009.11.035. - DOI - PubMed
    1. Kaern M, Elston T, Blake W, Collins JJ. Stochasticity in gene expression: from theories to phenotypes. Nat Rev Genet. 2005;6:451–464. doi: 10.1038/nrg1615. - DOI - PubMed
    1. Bernstein JA, Khodursky AB, Lin PH, Lin-Chao S, Cohen SN. Global analysis of mRNA decay and abundance in Escherichia coli at single-gene resolution using two-color fluorescent DNA microarrays. Proc Natl Acad Sci USA. 2002;99(15):9697–702. doi: 10.1073/pnas.112318199. - DOI - PMC - PubMed
    1. Rajala T, Häkkinen A, Healy S, Yli-Harja O, Ribeiro AS. Effects of Transcriptional Pausing on Gene Expression Dynamics. PLoS Comput Biol. 2010;6(3):e1000704. doi: 10.1371/journal.pcbi.1000704. - DOI - PMC - PubMed

Publication types

LinkOut - more resources