. 2011 Sep 22;71(6):1058-70.
doi: 10.1016/j.neuron.2011.07.028. Epub 2011 Sep 21.

GDE2 regulates subtype-specific motor neuron generation through inhibition of Notch signaling

Affiliations

GDE2 regulates subtype-specific motor neuron generation through inhibition of Notch signaling

Priyanka Sabharwal et al. Neuron. .

Abstract

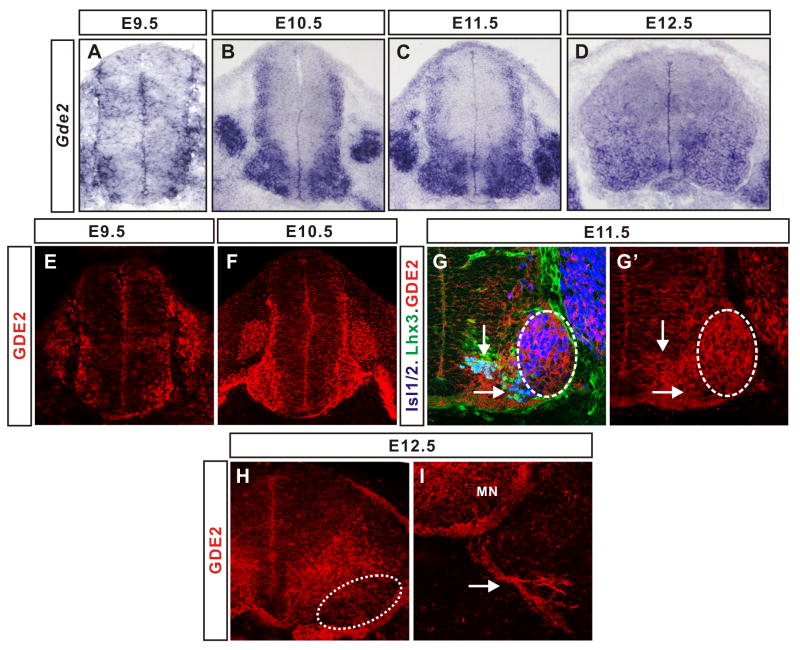
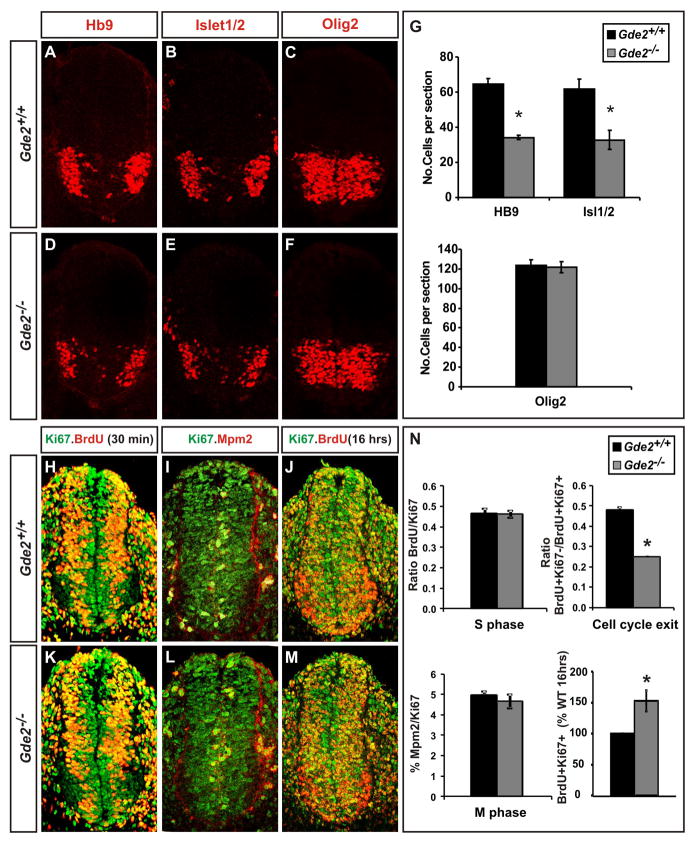
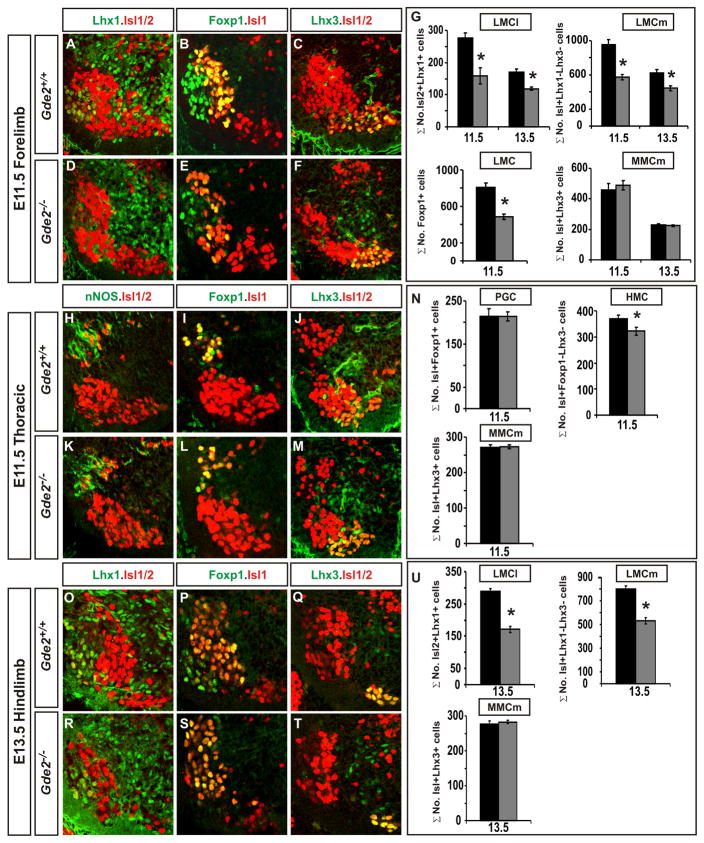
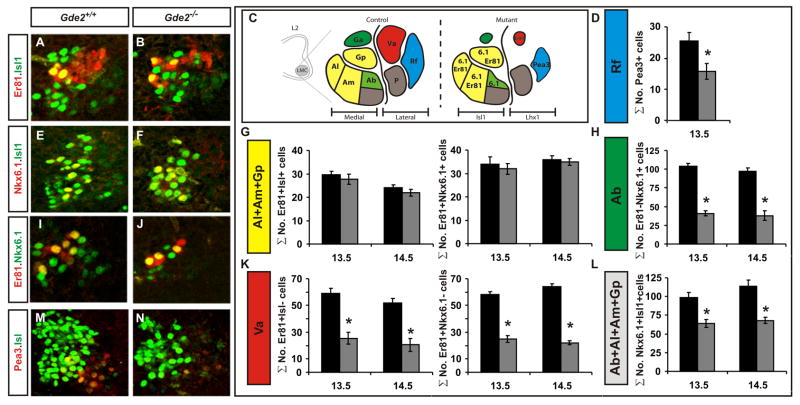
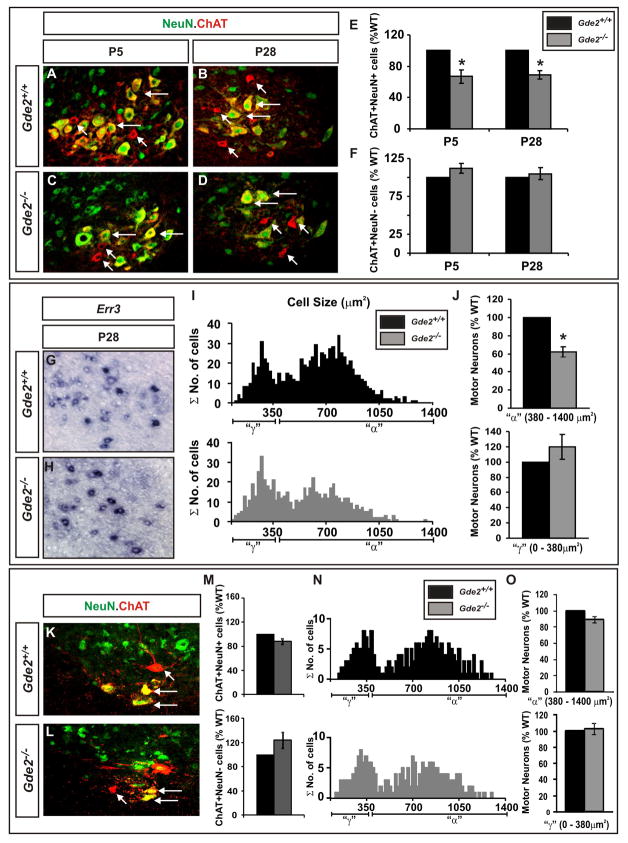
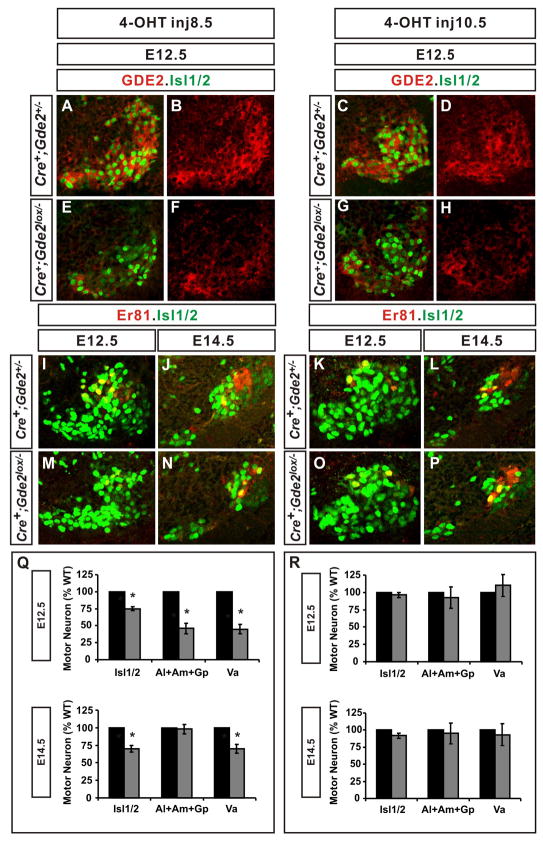
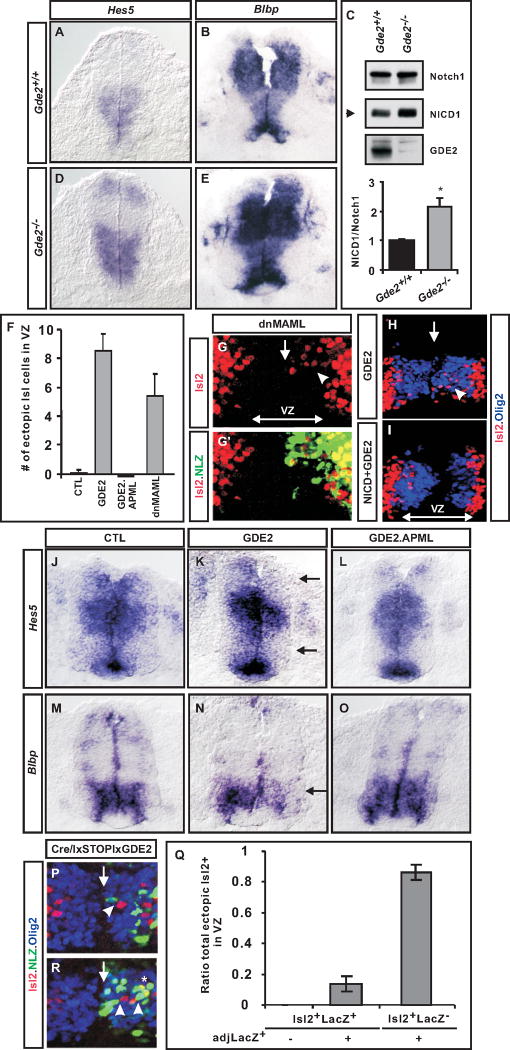
The specification of spinal interneuron and motor neuron identities initiates within progenitor cells, while motor neuron subtype diversification is regulated by hierarchical transcriptional programs implemented postmitotically. Here we find that mice lacking GDE2, a six-transmembrane protein that triggers motor neuron generation, exhibit selective losses of distinct motor neuron subtypes, specifically in defined subsets of limb-innervating motor pools that correlate with the loss of force-generating alpha motor neurons. Mechanistically, GDE2 is expressed by postmitotic motor neurons but utilizes extracellular glycerophosphodiester phosphodiesterase activity to induce motor neuron generation by inhibiting Notch signaling in neighboring motor neuron progenitors. Thus, neuronal GDE2 controls motor neuron subtype diversity through a non-cell-autonomous feedback mechanism that directly regulates progenitor cell differentiation, implying that subtype specification initiates within motor neuron progenitor populations prior to their differentiation into postmitotic motor neurons.


Figures

Figure 1
Figure 1. GDE2 expression in developing motor neurons
(A–D) In situ expression analyses of Gde2 mRNA on sections of embryonic mouse forelimb spinal cords. Gde2 transcripts are detected in developing motor neuron cell bodies, dorsal root ganglia and in dorsal-lateral regions of the spinal cord. (E–I) Confocal images of GDE2 protein expression in mouse spinal cord forelimb sections. (G, G′) GDE2 protein expression in relation to motor neuron columnar markers. GDE2 expression alone is shown in G′ for comparison. Vertical arrow=newly differentiating motor neurons; horizontal arrow=MMC, hatched areas=LMC, medially located MMC neurons. (H, I) Hatched circle marks location of motor neurons (MN) in the ventral horn at E12.5, which shows weak GDE2 expression; at this stage, GDE2 is enriched in motor axons (arrow). See also Figure S1.
Figure 2
Figure 2. GDE2 is required for motor neuron generation
(A–F; H–M) Confocal images of sections of E9.5 mouse spinal cord. (H, K, J, M) S-phase and cell-cycle exit indices were calculated 30min and 16hrs after BrdU injections respectively. (G) Graphs quantifying HB9+ and Isl1/2+ motor neurons and Olig2+ motor neuron progenitors (HB9 *p= 0.0014; Isl1/2 *p=0.004; Olig2 p= 0.3; n= 5) (N) Graphs of S-phase, M-phase, cell-cycle exit indices and total number of S-phase cells after 16hr BrdU pulse (S-phase p= 0.91; cell-cycle exit *p=0.0005; M-phase p= 0.37; Total S-phase (18hrs) *p= 0.03; n= 4). All graphs: mean ± s.e.m., Student’s t-test. See also Figure S2.
Figure 3
Figure 3. GDE2 function is columnar specific
(A–F; H–M; O–T) Confocal images of ventral left quadrant of sections of E13.5 mouse spinal cords. (G) Graphs quantifying total motor neurons in E11.5 and E13.5 forelimb motor columns (LMCl E11.5 *p= 0.001, E13.5 *p= 0.005; LMCm E11.5 *p=0.002, E13.5 *p= 0.004; LMC E11.5 *p= 0.001; MMC E11.5 p= 0.205, E13.5 p= 0.374). (N) Graphs quantifying total motor neurons in E11.5 thoracic motor columns (PGC p= 0.94; HMC *p= 0.01; MMC p= 0.64) (U) Graphs quantifying total motor neurons in E13.5 hindlimb motor columns (LMCl *p= 0.0004; LMCm *p= 0.0006; MMC p= 0.664). All graphs: mean ± s.e.m., Student’s t-test, n= 4. See also Figure S3.
Figure 4
Figure 4. GDE2 function is restricted to specific LMC motor pools
(A, B, E, F, I, J, M, N) Confocal images of ventral left quadrant of E14.5 mouse LS2 spinal cord sections. (C) Schematic of distribution and molecular code of LS2 motor pools. (D, G, H, K, L) Graphs quantifying total motor neurons within E13.5 and E14.5 motor pools (Pea3 *p= 0.0014; Al+Am+Gp [Er81+ Isl1+] E13.5 p= 0.449, E14.5 p= 0.356, [Er81+ Nkx6.1+] E13.5 p= 0.67, E14.5 p= 0.815; Ab [Er81Nkx6.1+] E13.5 *p= 0.013, E14.5 *p= 0.007; Va [Er81+ Isl1] E13.5 *p= 0.0001, E14.5 *p= 0.005, [Er81+ Nkx6.1] E13.5 *p= 0.004, E14.5 *p= 0.002; Ab+Al+Am+Gp E13.5 *p= 0.004, E14.5 *p= 0.006. All graphs: mean ± s.e.m., Student’s t-test, E13.5 n= 4, E14.5 n=5. See also Figure S4.
Figure 5
Figure 5. GDE2 is required for LMC alpha motor neuron differentiation
Confocal images of ventral right quadrants of sectioned mouse spinal cords showing lateral (A–D) and medial (K, L) motor neurons. Horizontal arrows: alpha (α) motor neurons. Angled arrows: gamma (γ) motor neurons. (E, F) Graphs quantifying percentage lateral [panel E: P5 *p= 0.009, P28 *p= 0.007; panel F: P5 p= 0.56, P28 p= 0.45] and medial motor neurons [M, Chat+NeuN+ p= 0.09, Chat+NeuN p= 0.19]. (G, H) In situ hybridization analyses of sectioned lateral ventral horns of spinal cord. (I) Histograms of somal cell area of ChAT+ lateral motor neurons at P28 (n=845 cells) Average somal areas [mean (μ)]: Gde2+/+: putative α motor neurons = 703.04μm2 ± 196.64 [SD (σ)], putative γ motor neurons = 239.47 μm2 ± 69.7; Gde2−/−: putative α motor neurons = 609.04μm2 ± 210.17, putative γ motor neurons = 246.34μm2 ± 96.4. (J, O) Graphs quantifying percentage putative γ and α motor neurons according to somal area. Threshold cutoff sizes for lateral and medial γ motor neuron populations were estimated as 380μm2 in cell area (μ + 2σ of the fitted small population distribution in controls); panel J α motor neurons *p= 0.0004; γ motor neurons p= 0.3; panel O α motor neurons p= 0.69; γ motor neurons p= 0.1. (N) Histograms of somal cell area of ChAT+ medial motor neurons at P28 (n= 229 cells) Average somal areas: Gde2+/+: putative α motor neurons = 818.33μm2 ± 196, putative γ motor neurons = 268.05 μm2 ± 84.56; Gde2−/−: putative α motor neurons = 794.51 μm2 ± 207.93, putative γ motor neurons = 267.36 μm2 ± 86.68. All graphs: mean ± s.e.m., One sample t-test, n= 4.
Figure 6
Figure 6. GDE2 functions during the period of motor neuron generation
(A–P) Confocal images of ventral right quadrant of mouse LS2 spinal cord sections at E12.5 except where stated. (Q, R) Graphs quantifying the percentage motor neurons within E12.5 and E14.5 motor pools, black bar: Cre+; Gde2+/−, grey bar: Cre+; Gde2lox/− [panel Q: E12.5 Isl1/2 *p= 0.0002, Al+Am+Gp *p= 0.007, Va *p= 0.001; E14.5 Isl1/2 *p= 0.0017, Al+Am+Gp p= 0.75, Va *p= 0.02. panel R: E12.5 Isl1/2 p= 0.382, Al+Am+Gp p= 0.509, Va p= 0.761; E14.5 Isl1/2 p= 0.255, Al+Am+Gp p= 0.477, Va p= 0.676]. All graphs: mean ± s.e.m., One sample t-test, n= 3. See also Figure S5.
Figure 7
Figure 7. GDE2 inhibits Notch signaling
In situ hybridizations of transverse sections of E9.5 (A, D) and E10.5 (B, E) mouse and electroporated chick spinal cords at HH St 19 (J–O) showing expression of Hes5 and Blbp transcripts. Arrows mark areas of Notch inhibition. (C) Western blot of dissected E10.5 spinal cord extracts from Gde2−/− embryos and WT littermates. Graph shows densitometric quantitation of NICD/full length Notch ratios from Western blots *p= 0.035, n=4. (F) Graph shows average number of ectopic Isl2+ motor neurons/section in VZ of electroporated chick spinal cords, n=8–10. (G, G′, H, I) Confocal images of transverse sections of chick spinal cords electroporated on the right; VZ, ventricular zone; vertical arrow, midline. Arrowheads mark ectopic Isl2+ motor neurons. (P, R) Two examples of chick spinal cords electroporated on the right with Lox-STP-Lox GDE2, and CMV:Cre plasmids. Green cells express GDE2; neighboring red cells are progenitors that have differentiated into Isl2+ motor neurons. * in R marks Isl2+ cells expressing GDE2. (Q) Graph quantifying ectopic Isl2+ motor neurons with respect to LacZ GDE2+ cells n= 161 cells. All graphs: mean ± s.e.m., Student’s t-test. Statistical analyses using a simple binomial distribution showed that the results we obtain cannot be explained by chance (see supplemental methods). See also Figure S6.

References

    1. Agalliu D, Takada S, Agalliu I, McMahon AP, Jessell TM. Motor neurons with axial muscle projections specified by Wnt4/5 signaling. Neuron. 2009;61:708–720. - PMC - PubMed
    1. Arber S, Han B, Mendelsohn M, Smith M, Jessell TM, Sockanathan S. Requirement for the homeobox gene Hb9 in the consolidation of motor neuron identity. Neuron. 1999;23:659–674. - PubMed
    1. Arber S, Ladle DR, Lin JH, Frank E, Jessell TM. ETS gene Er81 controls the formation of functional connections between group Ia sensory afferents and motor neurons. Cell. 2000;101:485–498. - PubMed
    1. Badea TC, Wang Y, Nathans J. A noninvasive genetic/pharmacologic strategy for visualizing cell morphology and clonal relationships in the mouse. J Neurosci. 2003;23:2314–2322. - PMC - PubMed
    1. Burke RE, Strick PL, Kanda K, Kim CC, Walmsley B. Anatomy of medial gastrocnemius and soleus motor nuclei in cat spinal cord. J Neurophysiol. 1977;40:667–680. - PubMed

Publication types

MeSH terms