. 2011 Sep 22;71(6):1085-101.
doi: 10.1016/j.neuron.2011.08.007. Epub 2011 Sep 21.

Distinct modes of AMPA receptor suppression at developing synapses by GluN2A and GluN2B: single-cell NMDA receptor subunit deletion in vivo

Affiliations

Distinct modes of AMPA receptor suppression at developing synapses by GluN2A and GluN2B: single-cell NMDA receptor subunit deletion in vivo

John A Gray et al. Neuron. .

Abstract

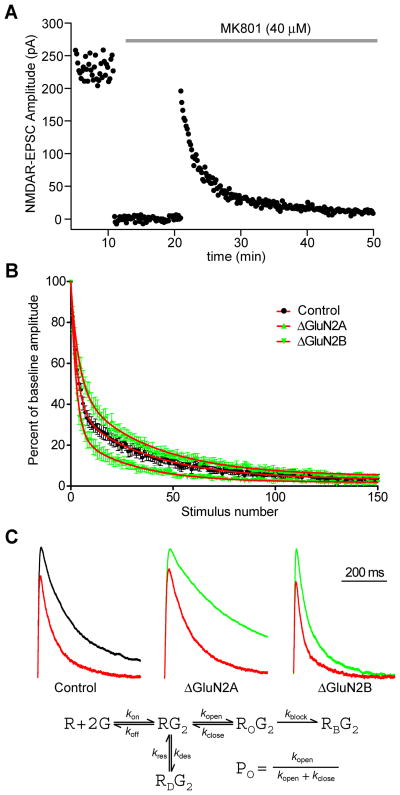
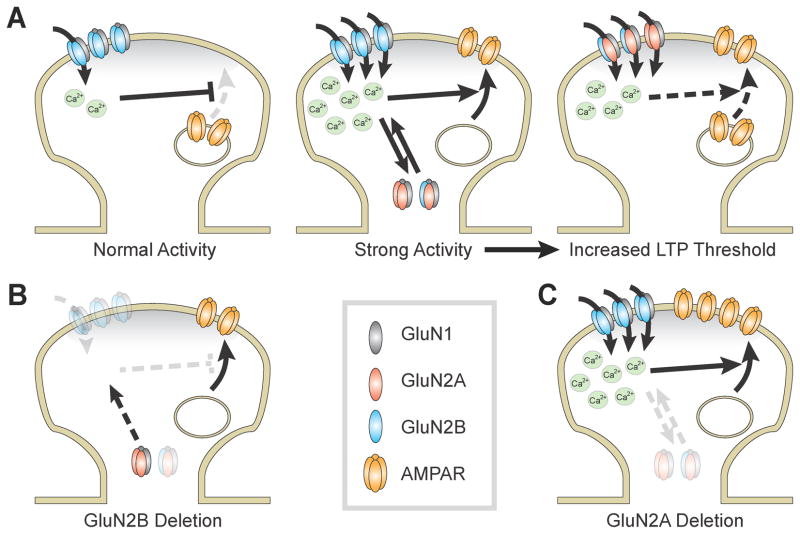
During development there is an activity-dependent switch in synaptic N-Methyl-D-aspartate (NMDA) receptor subunit composition from predominantly GluN2B to GluN2A, though the precise role of this switch remains unknown. By deleting GluN2 subunits in single neurons during synaptogenesis, we find that both GluN2B and GluN2A suppress AMPA receptor expression, albeit by distinct means. Similar to GluN1, GluN2B deletion increases the number of functional synapses, while GluN2A deletion increases the strength of unitary connections without affecting the number of functional synapses. We propose a model of excitatory synapse maturation in which baseline activation of GluN2B-containing receptors prevents premature synapse maturation until correlated activity allows induction of functional synapses. This activity also triggers the switch to GluN2A, which dampens further potentiation. Furthermore, we analyze the subunit composition of synaptic NMDA receptors in CA1 pyramidal cells, provide electrophysiological evidence for a large population of synaptic triheteromeric receptors, and estimate the subunit-dependent open probability.


Figures

Figure 1
Figure 1. Characterization of single-cell GluN2A, GluN2B, or double deletion
(A) Epifluorescence images (left, low magnification; inset high magnification) show mosaic expression of Cre-GFP in the CA1 region of a typical acute hippocampal slice made from a P18 mouse injected at P0 with rAAV1-Cre-GFP. Cre expression, and thus GFP, is confined to the nucleus. (B) Time course of changes in evoked NMDAR-EPSC amplitude in GRIN1fl/fl (gray) and GRIN2Afl/flGRIN2Bfl/fl (black) mice after P0 injection of rAAV1-Cre-GFP expressed as the mean ± SEM of the ratios of simultaneously recorded NMDAR-EPSCs from Cre to control cells recorded at +40 mV in the presence of 10 μM NBQX (n=3–6 for each group from P4–P14, n=10–21 for >P14); inset, representative traces from a P18 paired recording from GRIN2Afl/flGRIN2Bfl/fl mice (control, black; transfected, green; scale bar, 20 pA, 200 ms) (C) Averaged and peak-aligned NMDAR-EPSCs from transfected or control cells from GRIN2Afl/fl or GRIN2Bfl/fl mice at P18–P22 after P0 injection recorded at +40 mV in the presence of 10 μM NBQX. Bar graph shows the NMDAR-EPSC decay expressed as a weighted Tau (Control, 212.0±14.9 msec, n=35; ΔGluN2A, 467.1±24.1 msec, n=29; ΔGluN2B, 80.1±5.9 msec, n=26). (D) Averaged and base-aligned NMDAR-EPSCs. Bar graph shows the NMDAR-EPSC 10–90% rise time (Control, 8.2±0.9 msec, n=35; ΔGluN2A, 12.4±1.9 msec, n=29; ΔGluN2B, 6.1±0.4 msec, n=26). (E) I/V curves of NMDAREPSCs recorded at various holding potentials with 1.3 mM (left) or 0 mM (right) Mg2+. Junction potentials were corrected. Control, black; ΔGluN2A and ΔGluN2B, green. (F) NMDAR-EPSC decay times expressed as a weighted Tau from transfected or control cells from P20–P25 animals recorded at various holding potentials in the presence of 10 μM NBQX in 0 mM Mg2+. See also Figure S1.
Figure 2
Figure 2. Open probability of synaptic NMDARs depends on GluN2 subunit composition
Decrease of evoked NMDAR-EPSC amplitudes in MK801 from transfected or control cells from GRIN2Afl/fl or GRIN2Bfl/fl mice at P17–P21 after P0 injection. (A) Representative experiment plotting NMDAR-EPSC amplitude against time. A stable baseline was obtained, stimulation was stopped for 10 min as 40 μM MK801 was perfused onto the slice, then stimulation was restarted. (B) NMDAR-EPSC amplitudes were normalized to the average baseline amplitude and plotted as a function of stimulus number and each group was fit with a double exponential decay (Control, n=10; ΔGluN2A, n=7; ΔGluN2B, n=11; error bars represent SEM). (C) Normalized and averaged traces of the baseline NMDAR-EPSC and the first pulse in the presence of MK801 (red). Each experiment was fitted by a 5-state kinetic model (bottom) (Clements and Westbrook, 1991). Open probability (PO) was estimated to be 0.26 for control cells, 0.21 for ΔGluN2A, and 0.39 for ΔGluN2B. See also Figure S2.
Figure 3
Figure 3. Ifenprodil sensitivity of pure synaptic diheteromeric NMDARs and the developmental time course of subunit switch
(A) Representative evoked NMDAR-EPSC traces from transfected or control cells from GRIN2Afl/fl or GRIN2Bfl/fl mice at P18 after P0 injection of rAAV1-Cre-GFP recorded at +40 mV in the presence of 10 μM NBQX. Upper traces are baseline EPSCs, lower traces are 40–50 min after application of 3 μM ifenprodil (scale bars, 200 msec, 20 pA). Bar graph shows the ifenprodil sensitivity represented as a percent decrease in the peak current (Control, 49.1±6.6%, n=21; ΔGluN2A, 79.3±4.5%, n=13; ΔGluN2B, 4.5±2.3%, n=11. (B) Normalized representative traces from a Cre-expressing neuron GRIN2Afl/fl mice at baseline (black) and after 40–50 minutes of 3 μM ifenprodil application (gray). Graphs of individual cells pre- and post-ifenprodil show an increase in decay time (left, baseline 472.2±7.5, n=11; post-ifenprodil 518.1±11.3, n=11; p<0.001, paired t-test) and a decrease in charge transfer (right, baseline 47.9±4.3, n=11; postifenprodil 23.4±3.8, n=11; p<0.001, paired t-test). (C) Developmental time course of NMDAREPSC speeding in mouse and rat CA1 and mouse barrel cortex layer 2/3 pyramidal neurons. Filled symbols represent baseline NMDA-EPSC decay kinetics, open symbols represent decay kinetics 40–50 min after application of 3 μM ifenprodil. Recordings from GRIN2Afl/fl or GRIN2Bfl/fl mice included for comparison. Each point represents n=6–20 cells from at least 3 animals. (D) Effect of ifenprodil on NMDAR-EPSC decay kinetics after partial removal of GluN2B. Recordings from GRIN2Afl/fl mice are from P18–P20, and control and GRIN2Bfl/fl mice are from P4–P5. (E) Developmental time course of NMDAR-EPSC ifenprodil sensitivity, represented as percent decrease in peak current after ifenprodil. Recordings from GRIN2Afl/fl or GRIN2Bfl/fl mice included for comparison. (F) Estimated percent contribution of GluN2A and GluN2B subunits to the NMDAR-EPSC over development assuming triheteromeric receptors have intermediate decay kinetics (solid lines). Dashed lines represent the estimated total synaptic GluN2 subunits based on the open probability estimated in Figure 2 (0.39 for GluN1/GluN2A and 0.21 for GluN1/GluN2B). See also Figure S3.
Figure 4
Figure 4. NMDAR-EPSCs following deletion of GluN2A, GluN2B, or GluN2AGluN2B
(A–B) Scatter plots of peak amplitudes of evoked NMDAR-EPSCs from single pairs (open circles) and mean ± SEM (filled circles) from transfected and control cells at P16–P25 after P0 injection of rAAV1-Cre-GFP recorded at +40 mV in the presence of 10 μM NBQX. Dashed lines represent linear regression and 95% confidence interval. Sample traces are as follows: control cell, black; transfected cell, green; scale bars, 100 msec, 25 pA. (A) GRIN1fl/fl or GRIN2Afl/flGRIN2Bfl/fl mice. Bar graph represents the mean ± SEM of the ratios of transfected to control cells from for each pair (ΔGluN1, 0.04±0.02, n=16, p<0.001; ΔGluN2AΔGluN2B, 0.05±0.03, n=15, p<0.001). (B) GRIN2Afl/fl or GRIN2Bfl/fl mice, (ΔGluN2A, 1.11±0.14, n=21, p=0.89; ΔGluN2B, 0.65±0.10, n=17, p=0.007). (C) Scatter plots of the charge transfer of NMDAR-EPSCs from (B), (ΔGluN2A, 1.79±0.21, n=21, p<0.001; ΔGluN2B, 0.24±0.04, n=17, p<0.001). Significance determined by Wilcoxon signed-rank test.
Figure 5
Figure 5. Deletion of GluN2 subunits enhances postsynaptic excitatory transmission
(A–B) Scatter plots of the peak amplitudes of evoked AMPAR-EPSCs from single pairs (open circles) and mean ± SEM (filled circles) from transfected and control cells at P16–P25 after P0 injection of rAAV1-Cre-GFP recorded at −70 mV. Dashed lines represent linear regression and 95% confidence interval. Sample traces are as follows: control cell, black; transfected cell, green; scale bars, 15 msec, 40 pA. (A) GRIN1fl/fl or GRIN2Afl/flGRIN2Bfl/fl mice. Bar graph represents the mean ± SEM of the ratios of transfected to control cells from for each pair (ΔGluN1, 2.09±0.18, n=15, p<0.001; ΔGluN2AΔGluN2B, 1.75±0.15, n=21, p<0.001) (B) GRIN2Afl/fl or GRIN2Bfl/fl mice, (ΔGluN2A, 1.78±0.17, n=25, p<0.001; ΔGluN2B, 1.72±0.15, n=20, p<0.001) (C) Bar graph shows mean ± SEM of the AMPAR-EPSC paired-pulse ratio (control, 1.71±0.10, n=29; ΔGluN2A, 1.66±0.07, n=7; ΔGluN2B, 1.84±0.09, n=15; ΔGluN2AΔGluN2B, 1.66±0.29, n=8; ΔGluN1, 1.69±0.06, n=6). Left are representative traces (scale bars, 15 msec, 40 pA) (D) Bar graph shows mean ± SEM of the AMPAR-EPSC rectification index recorded in the presence of APV (control, 0.96±0.07, n=19; ΔGluN2A, 0.93±0.12, n=6; ΔGluN2B, 0.89±0.09, n=8; ΔGluN2AΔGluN2B, 0.92±0.16, n=5; ΔGluN1, 1.01±0.11, n=6). Left are representative traces (scale bars, 15 msec, 40 pA). Significance determined by Wilcoxon signed-rank test.
Figure 6
Figure 6. Differential effects of GluN2 subunit deletion on mEPSCs
Cumulative distributions and paired average mEPSC amplitudes and inter-event intervals (or frequency) from control (black) and Cre-expressing (green) CA1 pyramidal cells. (A) GRIN2Afl/fl mice (mEPSC amplitude: control, 7.69±0.23; Cre, 9.28±0.25; n=13, p<0.001; frequency: control, 0.134±0.011; Cre, 0.146±0.012; n=13, p=0.059). (B) GRIN2Bfl/fl mice (mEPSC amplitude: control, 8.01±0.25; Cre, 7.96±0.25; n=13, p=0.88; frequency: control, 0.114±0.012; Cre, 0.209±0.012; n=13, p<0.001). (C) GRIN2Afl/flGRIN2Bfl/fl mice (mEPSC amplitude: control, 7.85±0.24; Cre, 8.94±0.33; n=24, p<0.001; frequency: control, 0.123±0.005; Cre, 0.173±0.012; n=23, p<0.001). (D) Representative traces: black, control cell; green, CRE-expressing cell as indicated (scale bars: 10 sec, 10 pA). All data represented as mean ± SEM and analyzed by paired t-test.
Figure 7
Figure 7. Anatomic analysis of CA1 apical dendrites
(A) Dendritic spines were measured along the primary and secondary apical dendrites at 100– 200 μM from the cell body. Representative confocal stacks from Control and Cre-expressing cells; scale bar, 2 μm. Bar graph shows mean spine density (control, 22.14 ± 0.56, n=13; ΔGluN2A, 21.77 ± 1.12, n=10, p=0.76; ΔGluN2B, 17.80 ± 0.78, n=9, p<0.001; ΔGluN1, 20.38 ± 0.90, n=6, p=0.12; n is the number of neurons). (B) The apical dendritic tree was imaged and analyzed in 3D. Representative confocal stacks from Control and Cre-expressing cells; scale bar, 20 μm. Top bar graph shows mean apical dendrite length (mm) to 400 μm from the cell body (control, 3.77 ± 0.27, n=8; ΔGluN2A, 3.81 ± 0.27, n=7; ΔGluN2B, 3.72 ± 0.20, n=9; ΔGluN1, 3.92 ± 0.47, n=5). Bottom bar graph shows mean number of branch points to 400 μm from the cell body (control, 26.50 ± 1.88, n=8; ΔGluN2A, 28.00 ± 2.31, n=7; ΔGluN2B, 26.67 ± 2.26, n=9; ΔGluN1, 26.60 ± 0.98, n=5). Right, Sholl analysis showing no change in overall dendrite length and intersections at 10 μm increments.
Figure 8
Figure 8. GluN2 subunits suppress AMPARs by distinct means
(A) Coefficient of variation analysis of AMPAR-EPSCs from paired recordings of control and Cre-expressing cells from GRIN2Afl/fl or GRIN2Bfl/fl mice. Values above the 45° line suggest increases in quantal content (i.e. number of release sites × presynaptic release probability) while values approaching the horizontal line suggest a postsynaptic locus for the increase in AMPAR-EPSC amplitude. Unsilencing of synapses can mimic an increase in the number of release sites when presynaptic release probability is unchanged (see Figure 5C). ΔGluN2A cells (left) show a postsynaptic locus for the increase in AMPAR-EPSC amplitude, whereas ΔGluN2B cells (center) show an increase in quantal content consistent with an unsilencing of synapses. Dashed lines represent linear regression and 95% confidence interval. Summary graph (right) shows the mean ± SEM of the paired sets. (B–C) Synaptic failures measured during minimal stimulation experiments. Paired recordings of control (left) and Cre-expressing (center, green) cells from GRIN2Afl/fl (B) or GRIN2Bfl/fl (C) mice. Dots represent the peak evoked response amplitude from repetitive trials, gray bands represent approximate noise threshold. Histograms show the distributions of noise and post-stimulus amplitudes. Right: Quantification of synaptic failures in paired recordings; deletion of GluN2B (C, control 55.4 ± 5.7%, ΔGluN2B 40.32 ± 5.3%, n=11, p<0.01) but not GluN2A (B, control 45.9 ± 3.8%, ΔGluN2A 46.4 ± 5.4%, n=10, p=0.85) results in a reduction in synaptic failures. (D) Average EPSC amplitude from all trials (including failures) shows increased amplitude from both GRIN2Afl/fl (left, control 4.00 ± 0.44, ΔGluN2A 6.22 ± 0.37, n=10, p<0.001) and GRIN2Bfl/fl (right, control 3.10 ± 0.33, ΔGluN2B 4.54 ± 0.40, n=11, p<0.001) mice. (E) Average EPSC amplitude only from “non-failures” shows increased amplitude only from GRIN2Afl/fl (left, control 6.94 ± 0.74, ΔGluN2A 11.95 ± 0.71, n=10, p<0.001) but not GRIN2Bfl/fl (right, control 7.12 ± 0.51, ΔGluN2B 7.69 ± 0.39, n=11, p=0.23) mice. All data represented as mean ± SEM and analyzed by paired t-test.
Figure 9
Figure 9. Model for the role of GluN2 subunits in synaptic maturation
(A) During early postnatal development, modest activity through predominantly GluN2B-containing NMDARs at silent synapses (Adesnik et al., 2008) prevents the constitutive trafficking of AMPARs (Lu et al., 2011) to the postsynaptic density (PSD). This mechanism ensures that synapses only become functional after strong or correlated activity, when enough calcium enters to override the inhibitory pathway and drive AMPAR insertion (possibly via an LTP-like mechanism). This strong activity during early development also triggers the rapid switch from predominantly GluN2B-containing to predominantly GluN2A-containing NMDARs (Bellone and Nicoll, 2007). The increase in GluN2A subunits subsequently raises the threshold for further potentiation of AMPARs. (B) When GluN2B subunits are deleted during early postnatal development, the inhibitory ‘silencing’ signal is absent, and AMPARs constitutively traffic to the PSD, similar to the deletion of GluN1 (Adesnik et al., 2008). (C) When GluN2A subunits are deleted, strong activity through GluN2B-containing NMDARs drives synaptic AMPAR insertion, but there is no switch to GluN2A-containing NMDARs. In the absence of the NMDAR subunit switch, further AMPAR potentiation occurs unimpeded.

References

    1. Adesnik H, Li G, During MJ, Pleasure SJ, Nicoll RA. NMDA receptors inhibit synapse unsilencing during brain development. Proc Natl Acad Sci U S A. 2008;105:5597–5602. - PMC - PubMed
    1. Akashi K, Kakizaki T, Kamiya H, Fukaya M, Yamasaki M, Abe M, Natsume R, Watanabe M, Sakimura K. NMDA receptor GluN2B (GluR epsilon 2/NR2B) subunit is crucial for channel function, postsynaptic macromolecular organization, and actin cytoskeleton at hippocampal CA3 synapses. J Neurosci. 2009;29:10869–10882. - PMC - PubMed
    1. Al-Hallaq RA, Conrads TP, Veenstra TD, Wenthold RJ. NMDA di-heteromeric receptor populations and associated proteins in rat hippocampus. J Neurosci. 2007;27:8334–8343. - PMC - PubMed
    1. Al-Hallaq RA, Jarabek BR, Fu Z, Vicini S, Wolfe BB, Yasuda RP. Association of NR3A with the N-methyl-D-aspartate receptor NR1 and NR2 subunits. Mol Pharmacol. 2002;62:1119–1127. - PubMed
    1. Alvarez VA, Ridenour DA, Sabatini BL. Distinct structural and ionotropic roles of NMDA receptors in controlling spine and synapse stability. J Neurosci. 2007;27:7365–7376. - PMC - PubMed

Publication types

MeSH terms