. 2012 Jan 1;226(1):224-34.
doi: 10.1016/j.bbr.2011.09.022. Epub 2011 Sep 17.

Acetylcholine from the mesopontine tegmental nuclei differentially affects methamphetamine induced locomotor activity and neurotransmitter levels in the mesolimbic pathway

Affiliations

Acetylcholine from the mesopontine tegmental nuclei differentially affects methamphetamine induced locomotor activity and neurotransmitter levels in the mesolimbic pathway

Lauren K Dobbs et al. Behav Brain Res. .

Abstract

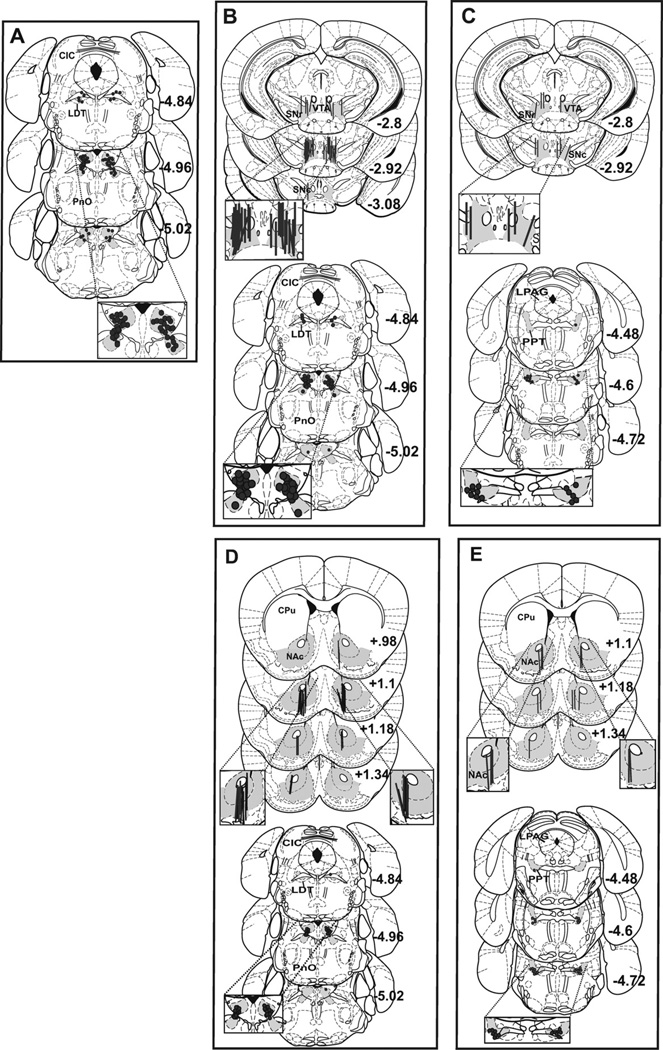
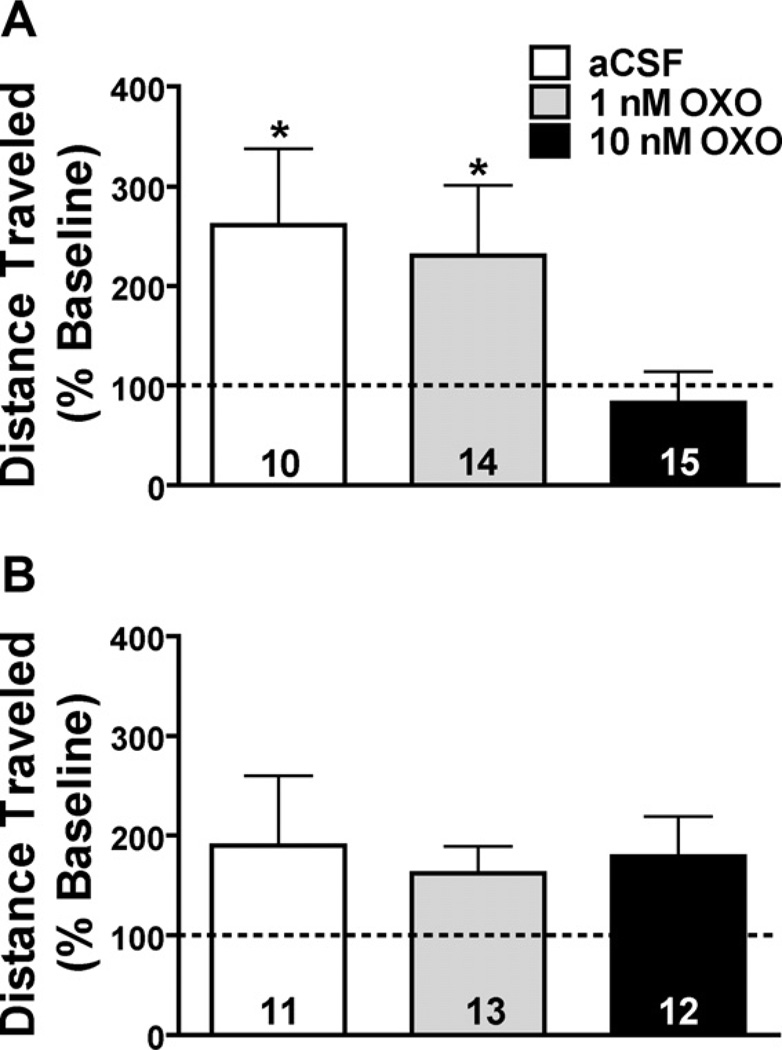
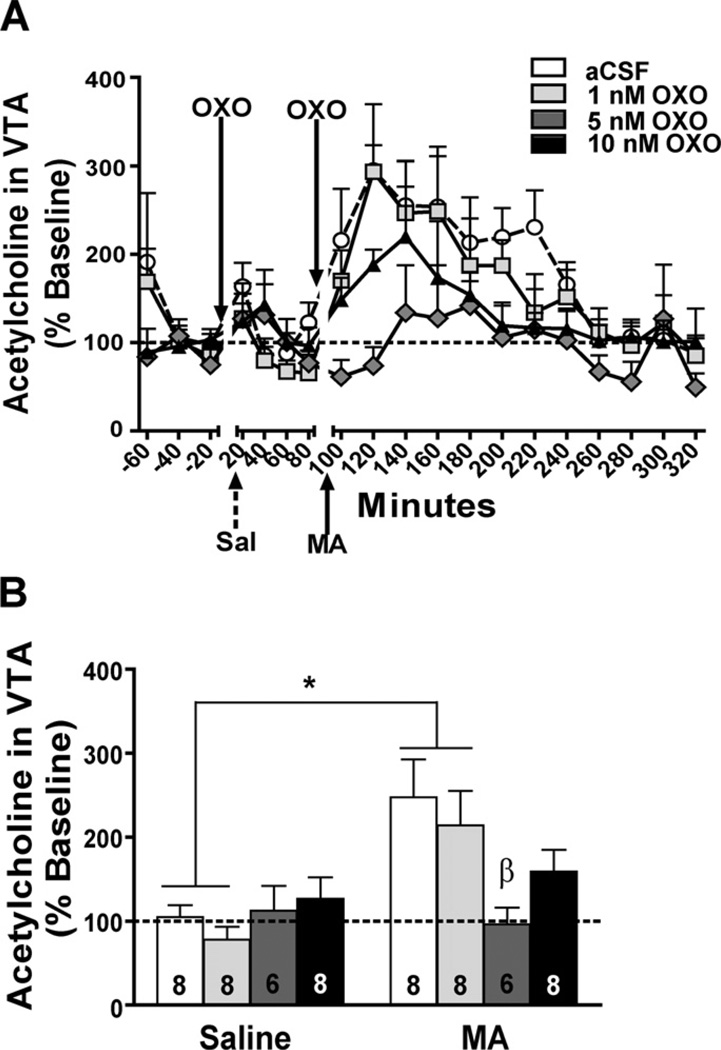
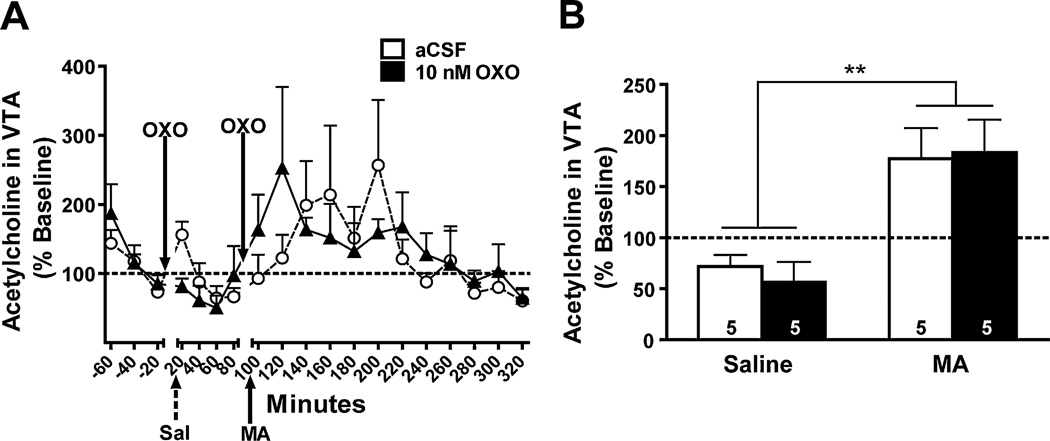
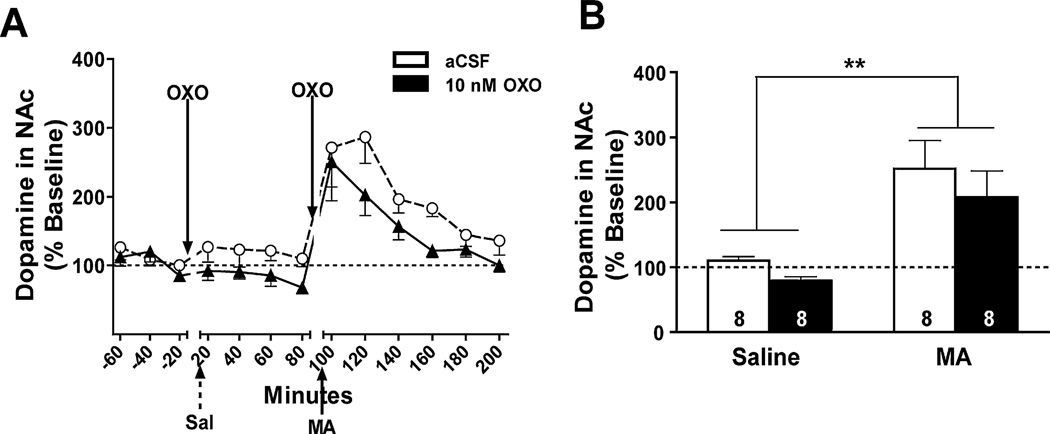
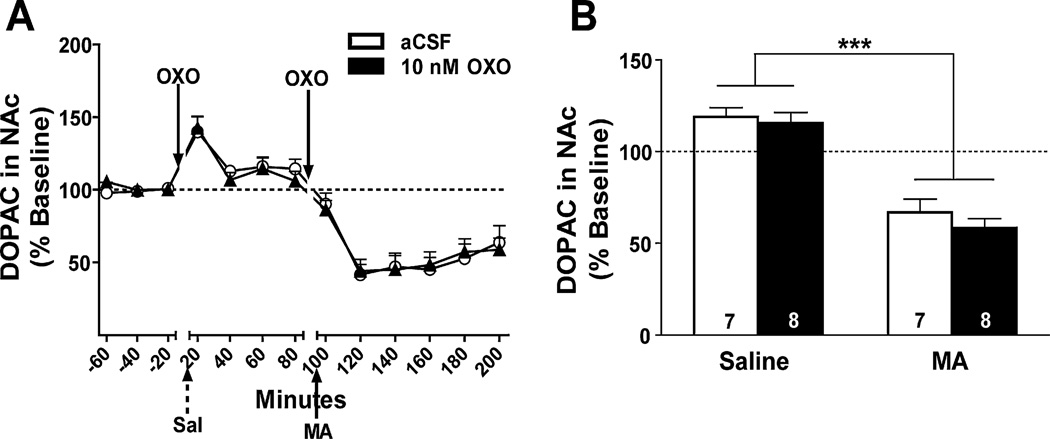
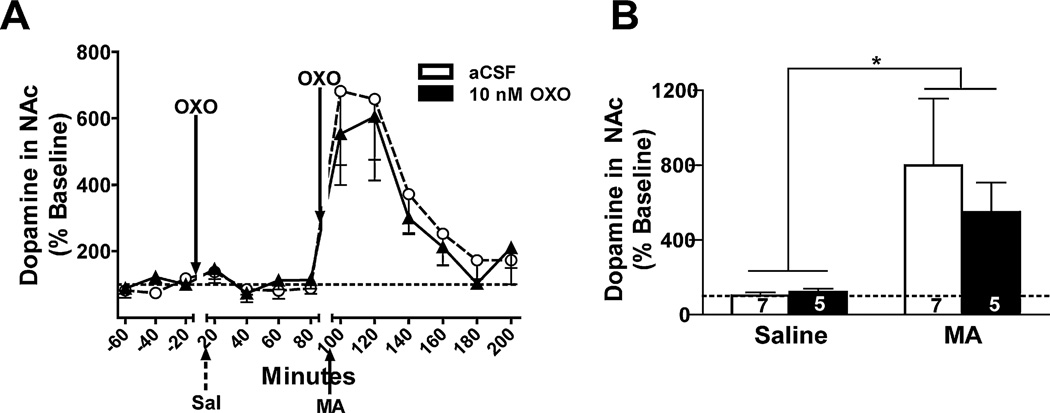
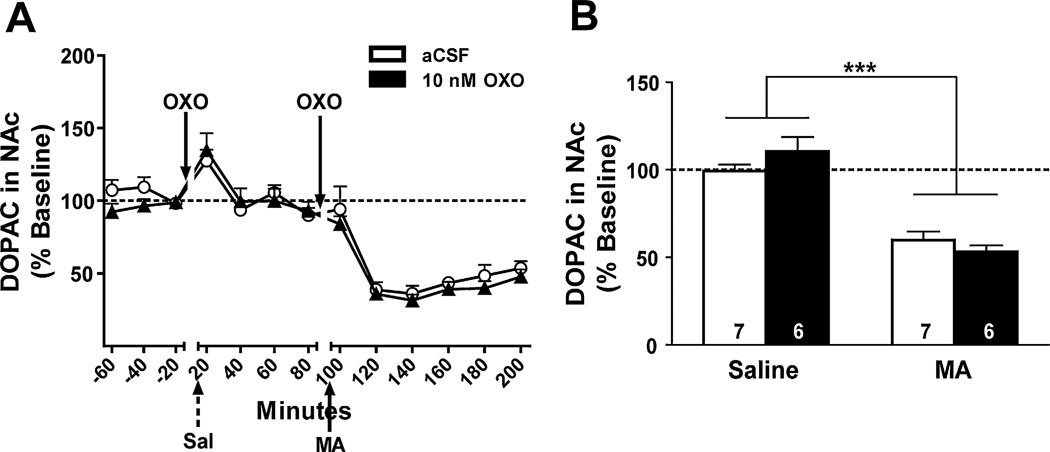
Methamphetamine (MA) increases dopamine (DA) levels within the mesolimbic pathway and acetylcholine (ACh), a neurotransmitter known to increase DA cell firing and release and mediate reinforcement, within the ventral tegmental area (VTA). The laterodorsal tegmental (LDT) and pedunculopontine tegmental (PPT) nuclei provide cholinergic input to the VTA; however, the contribution of LDT- and PPT-derived ACh to MA-induced DA and ACh levels and locomotor activation remains unknown. The first experiment examined the role of LDT-derived ACh in MA locomotor activation by reversibly inhibiting these neurons with bilateral intra-LDT microinjections of the M2 receptor agonist oxotremorine (OXO). Male C57BL/6J mice were given a bilateral 0.1μl OXO (0, 1, or 10nM/side) microinjection immediately prior to IP saline or MA (2mg/kg). The highest OXO concentration significantly inhibited both saline- and MA-primed locomotor activity. In a second set of experiments we characterized the individual contributions of ACh originating in the LDT or pedunculopontine tegmental nucleus (PPT) to MA-induced levels of ACh and DA by administering intra-LDT or PPT OXO and performing in vivo microdialysis in the VTA and NAc. Intra-LDT OXO dose-dependently attenuated the MA-induced increase in ACh within the VTA but had no effect on DA in NAc. Intra-PPT OXO had no effect on ACh or DA levels within the VTA or NAc, respectively. We conclude that LDT, but not PPT, ACh is important in locomotor behavior and the cholinergic, but not dopaminergic, response to systemic MA.


Figures

Fig. 1
Fig. 1
Microdialysis probe placements in the VTA and NAc and bilateral microinjection locations in the LDT and PPT are shaded and shown overlaid on plates taken from the atlas of Paxinos and Franklin [26]. Successful LDT microinjection targets for Experiment 1 are shown in panel A. Panels B and C show successful intra-VTA microdialysis probe placements for Experiments 2 and 3 (top) with the corresponding LDT (B, bottom) and PPT (C, bottom) microinjection locations. Panels D and E show successful intra-NAc microdialysis probe placements for Experiments 4 and 5 (top) with the corresponding LDT (D, bottom) and PPT (E, bottom) microinjection locations. Probe placements were counterbalanced for side and plates are labeled as mm from bregma. CIC: central nu of inferior colliculus; CPu: caudate putamen; LDT: laterodorsal tegmental nu; LPAG: lateral periaqueductal grey; NAc: nucleus accumbens; PnO: pontine reticular nu (oral part); PPT: pedunculopontine tegmental nu; SNc: substantia nigra, compact; SNr: substantia nigra, reticular; VTA: ventral tegmental area.
Fig. 2
Fig. 2
Effect of bilateral OXO microinjections into the LDT (A) or a dorsal control site, the inferior colliculus (IC; B). Mice received IP saline or MA immediately following the microinjection. Data are depicted as a percent of baseline (represented by the dotted line) and collapsed on IP treatment with OXO group sample sizes on their respective bar. (A) Mice pretreated with a bilateral microinjection into the LDT of aCSF (white bar) or 1 nM OXO (grey bar) immediately followed by IP saline or MA (2 mg/kg) showed a significant increase in locomotor activity on test day. Pretreatment with 10 nM OXO (black bar) had no significant effect on locomotor activity. (B) Bilateral OXO pretreatment into the IC had no effect on test day locomotor activity. *p < 0.05 vs. baseline activity.
Fig. 3
Fig. 3
Effect of bilateral OXO microinjections into the LDT on ACh levels in the VTA. Data are depicted as a percent of baseline (represented by the dotted line). (A) The ACh time course in response to aCSF (white circles), 1 nM (light grey squares), 5 nM (dark grey diamonds), or 10 nM (black triangles) OXO microinjection and IP saline (Sal; broken arrow) or MA (3.5 mg/kg; solid arrow) is shown in 20-min bins. (B) ACh samples were collapsed for each mouse after saline injection (Saline) and in the first 80 min after MA injection (3.5 mg/kg; MA) for analysis. There was a significant increase in ACh levels in mice pretreated with aCSF (white bar) or 1 nM OXO (light grey bar) following IP MA compared to saline. Compared to aCSF, microinjection pretreatment with 5 nM OXO significantly decreased MA-induced ACh levels. Treatment group sample sizes are shown on their respective bar. *p < 0.05 MA vs. saline; β p < 0.05 vs. aCSF MA group.
Fig. 4
Fig. 4
Effect of bilateral OXO microinjections into the PPT on ACh levels in the VTA. Data are expressed as a percent of baseline (represented by the dotted line). (A) The time course of ACh in response to intra-PPT OXO (10 nM; solid triangles) or aCSF (open circles) microinjection and IP injection of saline (Sal; broken arrow) or MA (3.5 mg/kg; solid arrow) is shown in 20-min bins. (B) ACh samples were collapsed for each mouse after saline injection (Saline) and in the first 80 min after MA injection (3.5 mg/kg; MA) in each OXO treatment group for analysis. There was a significant increase in ACh levels following IP MA in both 10 nM OXO- (solid bar) and aCSF-pretreated (open bar) mice. Treatment group sample sizes are shown on their respective bar. **p = 0.001 vs. IP saline.
Fig. 5
Fig. 5
Effect of bilateral OXO microinjections into the LDT on DA levels in the NAc. Data are expressed as a percent of baseline (represented by the dotted line). (A) The time course of DA levels in response to intra-LDT OXO (10 nM; solid triangles) or aCSF (open circles) microinjection and IP injection of saline (Sal; broken arrow) or MA (3.5 mg/kg; solid arrow) is shown in 20-min bins. (B) DA samples were collapsed for each mouse after saline injection (Saline) and in the first 40 min after MA injection (3.5 mg/kg; MA) in each OXO treatment group for analysis. Microinjection of 10 nM OXO (solid bar) into the LDT had no effect on the MA-induced increase in DA levels. Treatment group sample sizes are shown on their respective bar. **p = 0.001 vs. IP saline.
Fig. 6
Fig. 6
Effect of bilateral OXO microinjections into the LDT on levels of the DA metabolite, DOPAC, in the NAc. Data are expressed as a percent of baseline (represented by the dotted line). (A) The time course of DOPAC levels in response to intra-LDT OXO (solid triangles) or aCSF (open circles) microinjection and IP injections of saline (Sal; broken arrow) or MA (3.5 mg/kg; solid arrow) is shown in 20-min bins. (B) Data were collapsed after saline injection (Saline) and the first 40 min after MA injection (MA) in each OXO treatment group for analysis. There was a significant decrease in DOPAC levels after IP MA in both 10 nM OXO- (solid bar) and aCSF-pretreated (open bar) mice. Treatment group sample sizes are shown on their respective bar. ***p < 0.0001 vs. IP saline.
Fig. 7
Fig. 7
Effect of bilateral OXO microinjections into the PPT on DA levels in the NAc. Data are expressed as a percent of baseline (represented by the dotted line). (A) The time course of DA levels in response to OXO (solid triangles) or aCSF (open circles) and IP saline (Sal; broken arrow) or MA (3.5 mg/kg; solid arrow) is shown in 20-min bins. (B) Data were collapsed after saline injection (Saline) and the first 40 min after MA injection (MA) in each OXO treatment group for analysis. There was a significant increase in DA levels following IP MA compared to saline in both 10 nM OXO- (solid bar) and aCSF-pretreated (open bar) mice. Treatment group sample sizes are shown on their respective bar. *p < 0.05 vs. IP saline.
Fig. 8
Fig. 8
Effect of bilateral OXO microinjections into the PPT on levels of the DA metabolite, DOPAC, in the NAc. Data are expressed as a percent of baseline (represented by the dotted line). (A) The time course of DOPAC levels in response to OXO (black triangles) or aCSF (white circles) and IP saline (Sal; broken arrow) or MA (3.5 mg/kg; solid arrow) is shown in 20-min bins. (B) Data were collapsed after saline injection (Saline) and the first 40 min after MA injection (MA) in each OXO treatment group for analysis. There was a significant decrease in DOPAC levels following IP MA compared to saline in 10 nM OXO- (black bars) and aCSF-pretreated (white bars) mice. ***p < 0.0001 vs. IP saline.

References

    1. Winn P. How best to consider the structure and function of the pedunculopontine tegmental nucleus: evidence from animal studies. J Neurol Sci. 2006;248:234–250. - PubMed
    1. Wang HL, Morales M. Pedunculopontine and laterodorsal tegmental nuclei contain distinct populations of cholinergic, glutamatergic and GABAergic neurons in the rat. Eur J Neurosci. 2009;29:340–358. - PMC - PubMed
    1. Oakman SA, Faris PL, Kerr PE, Cozzari C, Hartman BK. Distribution of pontomesencephalic cholinergic neurons projecting to substantia nigra differs significantly from those projecting to ventral tegmental area. J Neurosci. 1995;15:5859–5869. - PMC - PubMed
    1. Omelchenko N, Sesack SR. Cholinergic axons in the rat ventral tegmental area synapse preferentially onto mesoaccumbens dopamine neurons. J Comp Neurol. 2006;494:863–875. - PMC - PubMed
    1. Forster GL, Blaha CD. Laterodorsal tegmental stimulation elicits dopamine efflux in the rat nucleus accumbens by activation of acetylcholine and glutamate receptors in the ventral tegmental area. Eur J Neurosci. 2000;12:3596–3604. - PubMed

Publication types

MeSH terms