. 2012 Feb 1;105(3):702-8.
doi: 10.1016/j.physbeh.2011.09.003. Epub 2011 Sep 10.

Depressive phenotypes evoked by experimental diabetes are reversed by insulin

Affiliations

Depressive phenotypes evoked by experimental diabetes are reversed by insulin

Nancy Ho et al. Physiol Behav. .

Abstract

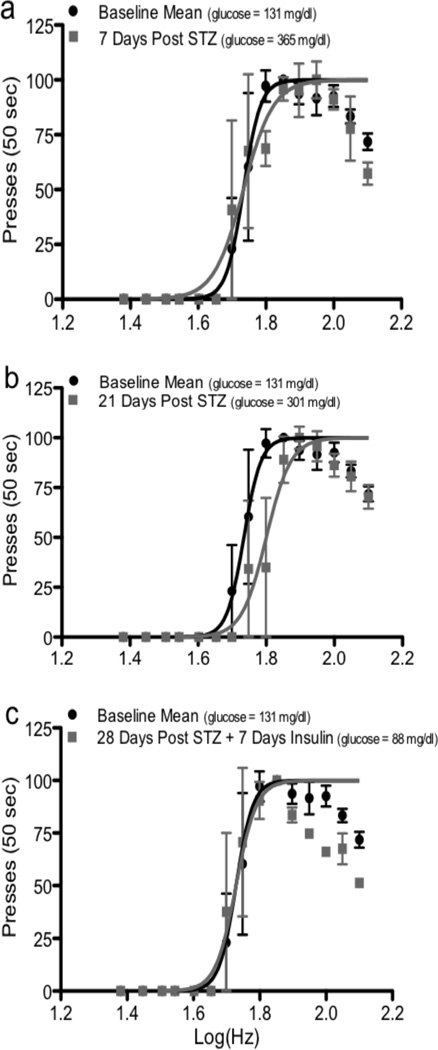
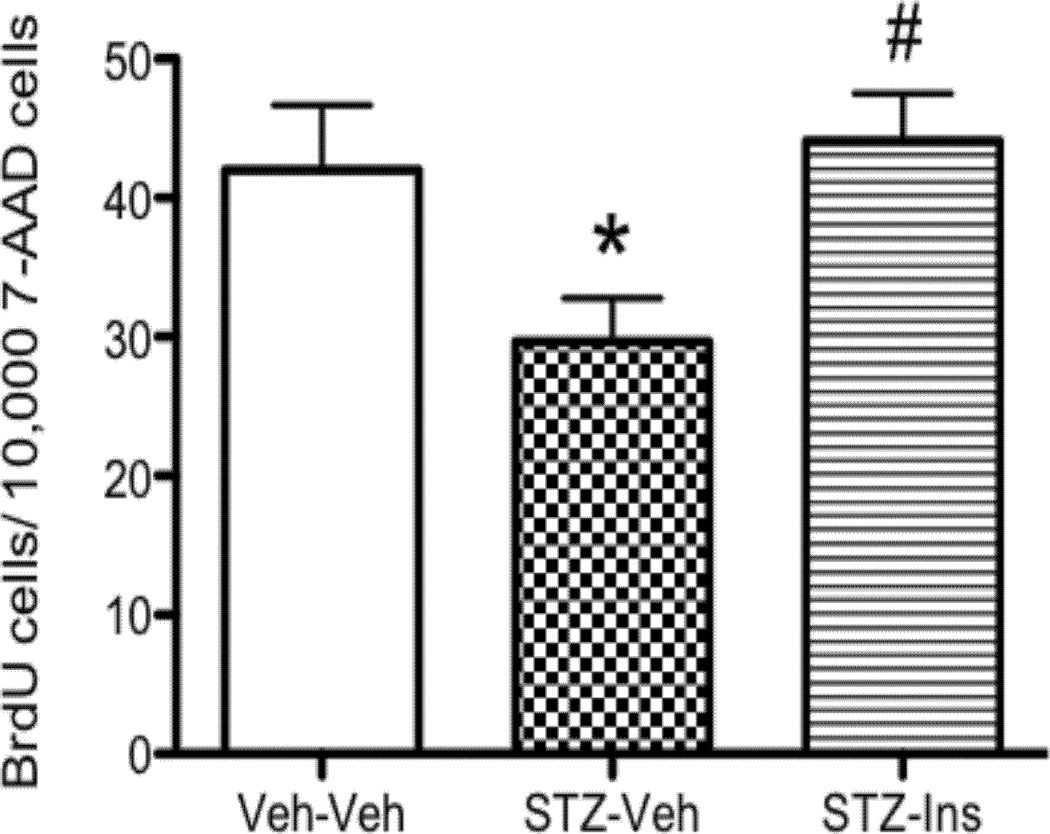
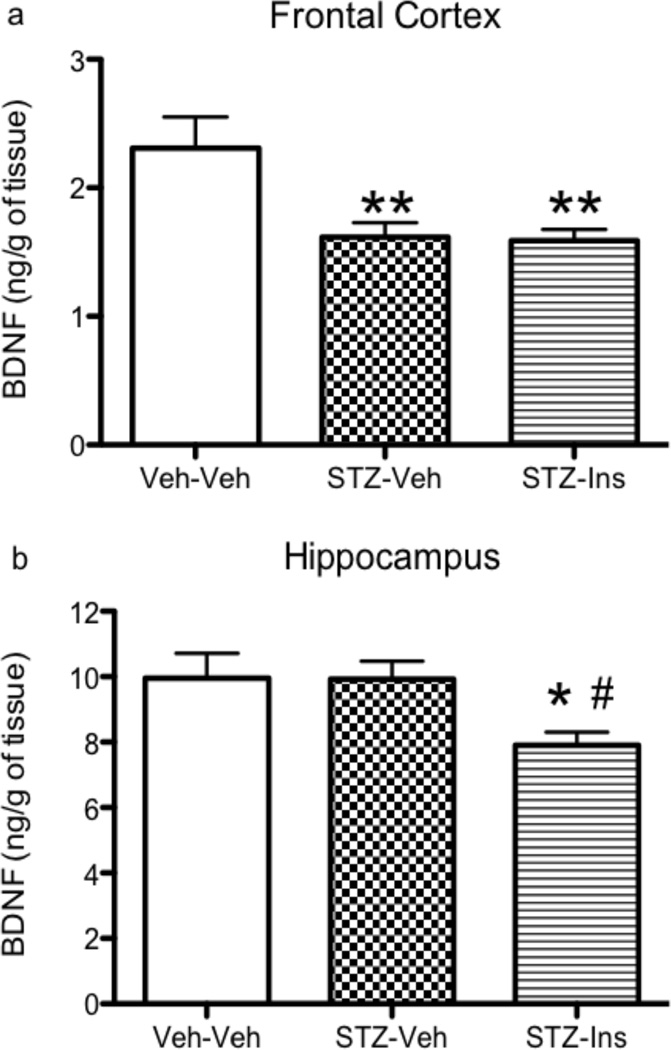
Clinical studies suggest a bidirectional relationship between diabetes and depression, where diabetes may increase risk for depressive symptoms and depression may increase risk for diabetes. Preclinical models examining the effects of diabetes on brain and behavior can provide insights to the pathophysiology underlying this relationship. The current study comprehensively examined, in C57BL/6 mice, the development of depressive phenotypes evoked by diabetes induced by streptozotocin (STZ) and determined if insulin treatment was able to reverse the diabetes-related changes on brain and affective behavior. Since anxiety is often comorbid with mood disturbances, behavioral tests for both anxiety and depression were administered. Possible physiological correlates of behavioral changes, including hippocampal cell proliferation, brain derived neurotrophic factor, and plasma corticosterone, were also measured. STZ-induced diabetes resulted in increased immobility in the tail suspension test, increased intracranial self-stimulation thresholds, decreased hippocampal cell proliferation, and increased corticosterone levels. Insulin treatment, on the other hand, reduced hyperglycemia, reversed the behavioral effects, and returned hippocampal cell proliferation and corticosterone to levels comparable to the control group. Anxiety-related behaviors were unaffected. This study showed that experimental diabetes in the mouse produced depressive phenotypes that were reversed by insulin therapy. Changes in reward-related behaviors and hippocampal cell proliferation may be useful markers to identify therapeutic interventions for comorbid diabetes and depression.


Figures

Fig. 1
Fig. 1
Effect of diabetes and insulin treatment on behavior in the TST (a) and locomotor activity (b). (a) TST immobility was significantly increased in diabetic mice (STZ-Veh) compared to controls, while the insulin treatment (STZ-Ins) completely reversed the TST changes induced by diabetes. (b) Both diabetic and insulin-treated groups showed significantly decreased locomotor activity compared to controls. Symbols represent mean values ± S.E.M. Asterisks (**) denote significant difference compared to Veh-Veh (p < 0.01). Number signs (##) denote significant difference compared to STZ-Veh (p < 0.01).
Fig. 2
Fig. 2
Effect of diabetes and insulin treatment on ICSS performance. Graphs show data organized by treatment, vehicle (Veh, n = 4) and streptozotocin (STZ, n = 6). Baseline values were determined during the week prior to STZ treatment. Weeks 1 and 3 correspond with untreated diabetes. During Week 4, STZ animals were treated with glargine, 100 mg/kg, s.q., once daily, while vehicle animals received saline. (a) Blood glucose levels (mg/dl) were measured at the end of each week. (b) Weekly mean maximum response values are expressed as a percent of the baseline. (c) Weekly mean thresholds are expressed as a percent of the baseline. Symbols represent mean values ± S.E.M. Asterisk (*) denotes significant difference compared to vehicle (**, p < 0.01; *** p < 0.001).
Fig. 3
Fig. 3
Longitudinal ICSS data from a single, representative STZ-diabetic mouse. Graphs show response values (presses per 50 seconds) as a function of stimulation frequencies for (a) during the development of diabetes at the end of Week 1, 7 days post STZ injection, (b) during the expression of diabetes at the end of Week 3, 21 days post STZ injection, and (c) during treatment for diabetes with glargine, 100 mg/kg, s.c. at the end of Week 4, the 7th day of consecutive glargine administration, and 28 days post STZ injection. Symbols represent mean response counts for passes 2, 3, and 4 ± S.E.M.
Fig. 4
Fig. 4
Effect of diabetes and insulin treatment on hippocampal cell proliferation. To study cell proliferation (n = 8–10 per group), BrdU (100 mg/kg × 4) was injected 24 hours prior to sacrifice in mice 6 weeks after administration of STZ. Insulin treatment was administered by implanted s.c. pellet during the last 5 weeks of the study. Symbols represent mean values ± S.E.M. Asterisk (*) denotes significant difference compared to Veh-Veh (p < 0.05). Number sign (#) indicates significant difference compared to STZ-Veh (p < 0.05).
Fig. 5
Fig. 5
Effect of diabetes and insulin treatment on hippocampal and cortical BDNF levels. The contralateral hippocampus that was not being used for flow cytometry measurement in the hippocampal cell proliferation study was used for BDNF analysis. Insulin pellets were implanted s.c. 1 week after STZ administration. Insulin treatment lasted for 5 weeks and frontal cortex (a) and hippocampal (b) BDNF levels were measured at study completion. Symbols represent mean values ± S.E.M. Asterisk (*) denotes significant difference compared to Veh-Veh (*, p < 0.05; **, p < 0.01). Number sign (#) indicates significant difference compared to STZ-Veh (p < 0.05).
Fig. 6
Fig. 6
Effect of diabetes and insulin treatment on plasma CORT levels. CORT levels were measured in mice in the hippocampal cell proliferation study. Insulin pellets were implanted s.c. 1 week after STZ administration. Insulin treatment lasted for 5 weeks and CORT levels were measured at study completion. Symbols represent mean values ± S.E.M. Asterisk (*) denotes significant difference compared to Veh-Veh (p < 0.05). Number sign (#) indicates significant difference compared to STZ-Veh (p < 0.05).
Fig. 7
Fig. 7

References

    1. Kahn LS, McIntyre RS, Rafalson L, Berdine DE, Fox CH. Fasting Blood Glucose and Depressive Mood among Patients with Mental Illness in a Medicaid Managed Care Program. Depression research and treatment. 2011;2011 862708. - PMC - PubMed
    1. Egede LE, Zheng D, Simpson K. Comorbid depression is associated with increased health care use and expenditures in individuals with diabetes. Diabetes Care. 2002;25:464–470. - PubMed
    1. Adili F, Larijani B, Haghighatpanah M. Diabetic patients: Psychological aspects. Ann N Y Acad Sci. 2006;1084:329–349. - PubMed
    1. Egede LE. Disease-focused or integrated treatment: diabetes and depression. Med Clin North Am. 2006;90:627–646. - PubMed
    1. Iosifescu DV. Treating depression in the medically ill. Psychiatr Clin North Am. 2007;30:77–90. - PubMed

Publication types

MeSH terms