. 2011 Nov 4;413(4):773-89.
doi: 10.1016/j.jmb.2011.09.011. Epub 2011 Sep 16.

Analysis of binding site hot spots on the surface of Ras GTPase

Affiliations

Analysis of binding site hot spots on the surface of Ras GTPase

Greg Buhrman et al. J Mol Biol. .

Abstract

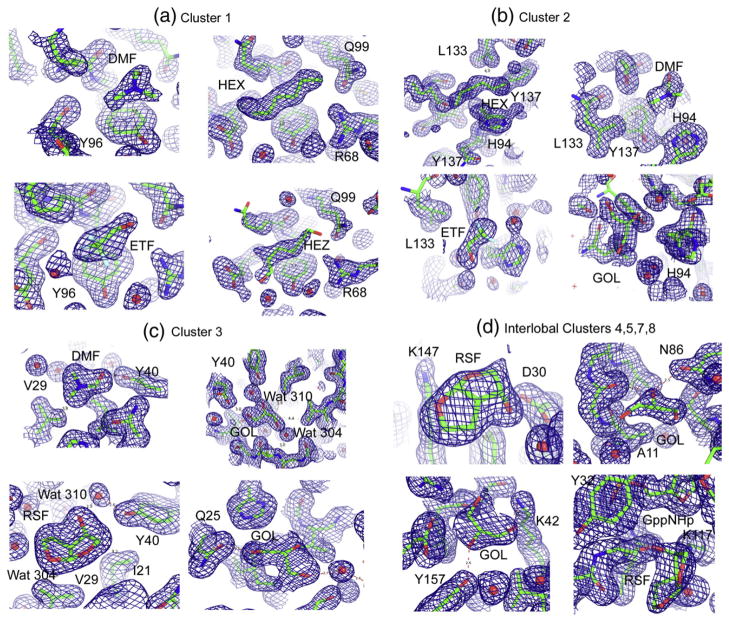
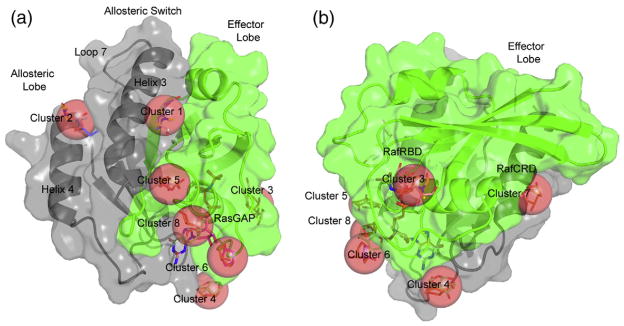
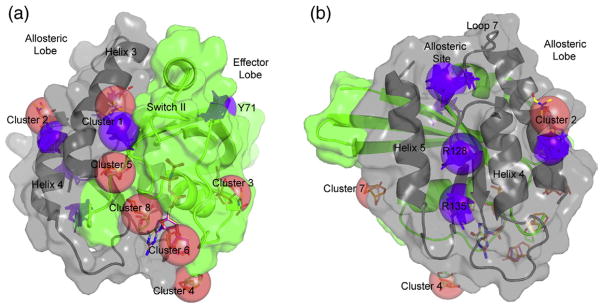
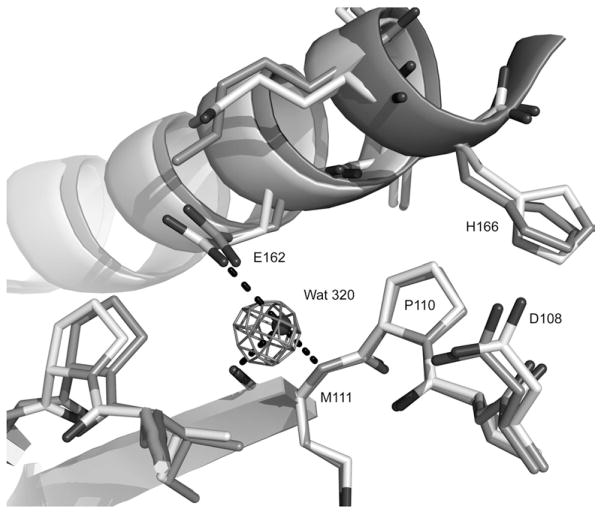
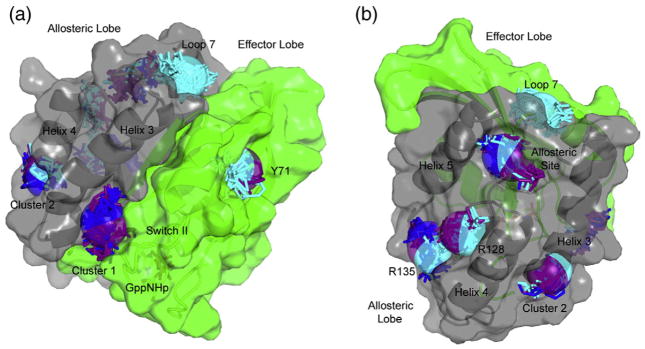
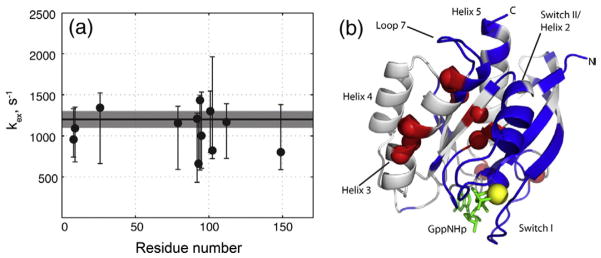
We have recently discovered an allosteric switch in Ras, bringing an additional level of complexity to this GTPase whose mutants are involved in nearly 30% of cancers. Upon activation of the allosteric switch, there is a shift in helix 3/loop 7 associated with a disorder to order transition in the active site. Here, we use a combination of multiple solvent crystal structures and computational solvent mapping (FTMap) to determine binding site hot spots in the "off" and "on" allosteric states of the GTP-bound form of H-Ras. Thirteen sites are revealed, expanding possible target sites for ligand binding well beyond the active site. Comparison of FTMaps for the H and K isoforms reveals essentially identical hot spots. Furthermore, using NMR measurements of spin relaxation, we determined that K-Ras exhibits global conformational dynamics very similar to those we previously reported for H-Ras. We thus hypothesize that the global conformational rearrangement serves as a mechanism for allosteric coupling between the effector interface and remote hot spots in all Ras isoforms. At least with respect to the binding sites involving the G domain, H-Ras is an excellent model for K-Ras and probably N-Ras as well. Ras has so far been elusive as a target for drug design. The present work identifies various unexplored hot spots throughout the entire surface of Ras, extending the focus from the disordered active site to well-ordered locations that should be easier to target.


Figures

Fig. 1
Fig. 1
Representative electron density maps contoured at 1 σ showing organic solvent molecules. The cluster numbers at the top of each panel correspond to those in Table 1. (a) The four organic molecules found in cluster 1: upper left, DMF; upper right, HEX; lower left, trifluoroethanol (ETF); lower right, HEZ. (b) The four organic molecules found in cluster 2: upper left, HEX; upper right, DMF; lower left, ETF; lower right, GOL. (c) The four organic molecules found in cluster 3: upper left, DMF; upper right, GOL; lower left, RSF; lower right, a second GOL molecule (GOL). Conserved water molecules 304 and 310 are shown. (d) Organic solvent molecules in the interlobal clusters: upper left, RSF in cluster 4; upper right, GOL in cluster 5; GOL in cluster 7; RSF in cluster 8. In all cases, the protein and organic solvents are shown as sticks. Water molecules are represented as red spheres, and hydrogen bonds are represented as red broken lines.
Fig. 2
Fig. 2
MSCS results for H-Ras-GppNHp in the “off” state of the allosteric switch. The effector lobe is shown in green, and the allosteric lobe is shown in gray. MSCS clusters 1 through 8 are shown with red spheres superimposed on the organic solvent molecules, which are in stick representation within each cluster. (b) is rotated by 90° relative to (a) in order to show sites 3 and 7.
Fig. 3
Fig. 3
Comparison of the MSCS and FTMap results for Ras-GppNHp in the “off” state of the allosteric switch. The effector lobe is shown in green, and the allosteric lobe is shown in gray. The MSCS clusters are shown as red spheres as in Fig. 2, and the FTMap clusters are shown in purple. (a) and (b) show two orientations of the molecule so that all clusters are visible.
Fig. 4
Fig. 4
Conserved water molecule Wat320 near the allosteric site. Protein atoms from Ras-GppNHp soaked in 50% ETF is shown in light gray with Wat320 from that model included as a dark sphere. The published model for K-Ras-GppNHp (PDB ID: 3GFT) is superimposed in dark gray. Wat320 is not present in this model, but electron density from a FoFc map contoured at 3 σ calculated using the 3GFT model and associated structure factors downloaded from the PDB show clearly that Wat320 is indeed present in K-Ras-GppNHp. Wat320 makes good hydrogen bonds (broken lines) with the backbone amide and carbonyl groups of M111 and with the side chain of E162 in both isoforms. His166 is turned away from the hot spots identified by FTMap in both models.
Fig. 5
Fig. 5
Comparison of the FTMap results for Ras in the three conformational substates associated with the GTP-bound form. The “off” state clusters are shown in purple as in Fig. 3. The “on” state 1 clusters are shown in blue, and the “on” state 2 clusters are shown in cyan. (a) and (b) show two orientations of the molecule so that all clusters are visible.
Fig. 6
Fig. 6
Representative relaxation dispersion profiles for K-Ras-GppNHp. The transverse relaxation rate constant of amide 15N nuclear spins in 1H–15N K-Ras (1–171) in complex with the GTP analogue GppNHp at 20 °C recorded at 14.1 T is plotted as a function of the CPMG pulse train frequency.
Fig. 7
Fig. 7
Conformational exchange dynamics in K-Ras-GppNHp. (a) Best-fit values of the exchange rate constants for K-Ras (1–171)/GppNHp at 20 °C are plotted versus the residue number. The 95% confidence intervals determined by Monte Carlo analysis are shown as asymmetric error bars. The value of the exchange rate constant determined from a global fit is shown as a horizontal continuous line with the corresponding 95% confidence interval given as a shaded area around the line. (b) Mapping of dynamic residues on the molecular model of K-Ras-GppNHp (PDB ID: 3GFT). The GTP analogue GppNHp is shown as green sticks, and the magnesium ion is shown as a yellow sphere. Amide nitrogen atoms of the residues involved in global conformational dynamics are shown as red spheres. Helices and switch regions are labeled. Blue indicates residues, which amide signals were not detected or assigned. The orientation of the molecule is the same as in Fig. 5a.

References

    1. Bourne HR, Sanders DA, McCormick F. The GTPase superfamily: conserved switch for diverse cell functions. Nature. 1990;348:125–132. - PubMed
    1. Boriack-Sjodin PA, Margarit SM, Bar-Sagi D, Kuriyan J. The structural basis of the activation of Ras by Sos. Nature. 1998;394:337–343. - PubMed
    1. Scheffzek K, Ahmadian MR, Kabsch W, Wiesmüller L, Lautwein A, Schmitz F, Wittinghofer A. The Ras–RasGAP complex: structural basis for GTPase activation and its loss in oncogenic Ras mutants. Science. 1997;277:333–338. - PubMed
    1. Herrmann C. Ras–effector interactions: after one decade. Curr Opin Struct Biol. 2003;13:122–129. - PubMed
    1. Cox AD, Der CJ. The dark side of Ras: regulation of apoptosis. Oncogene. 2003;22:8999–9006. - PubMed

Publication types