. 2011 Dec 26;313(1):64-75.
doi: 10.1016/j.canlet.2011.08.022. Epub 2011 Sep 6.

Chk2-mediated G2/M cell cycle arrest maintains radiation resistance in malignant meningioma cells

Affiliations

Chk2-mediated G2/M cell cycle arrest maintains radiation resistance in malignant meningioma cells

Venkateswara Rao Gogineni et al. Cancer Lett. .

Erratum in

  • Cancer Lett. 2014 Jul 28;349(2):155

Abstract

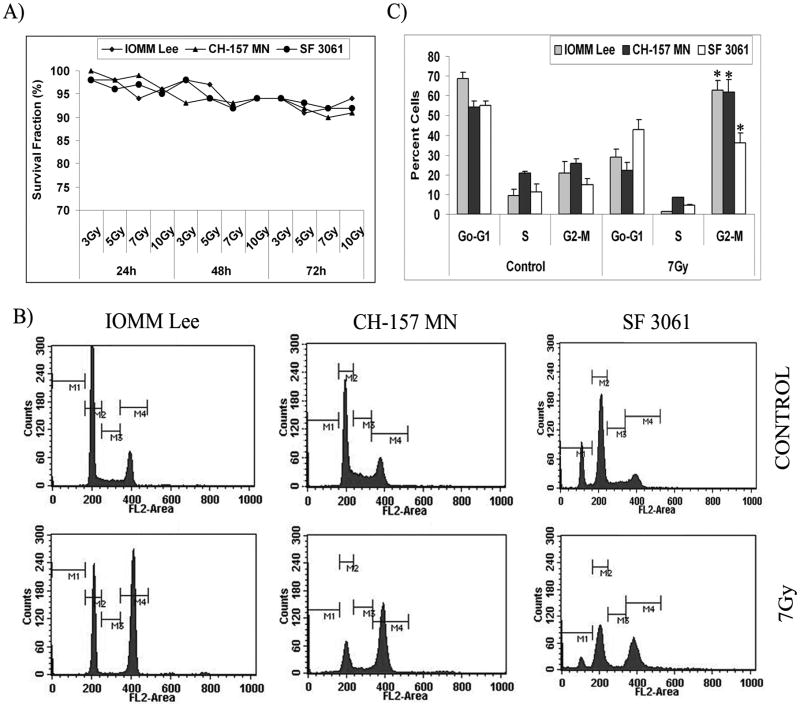
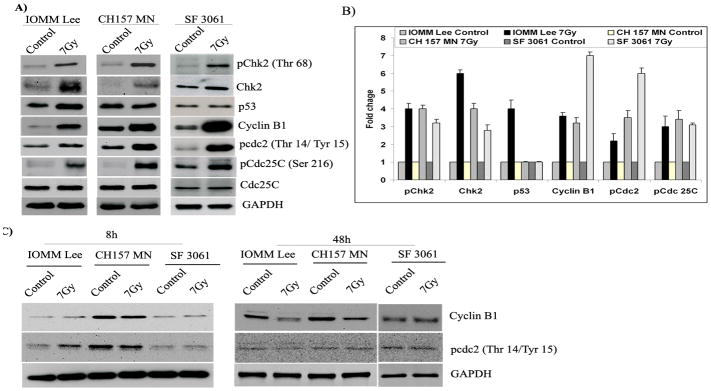
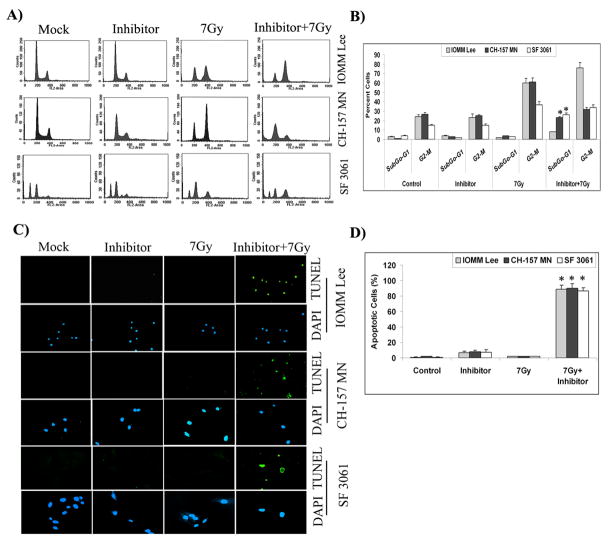
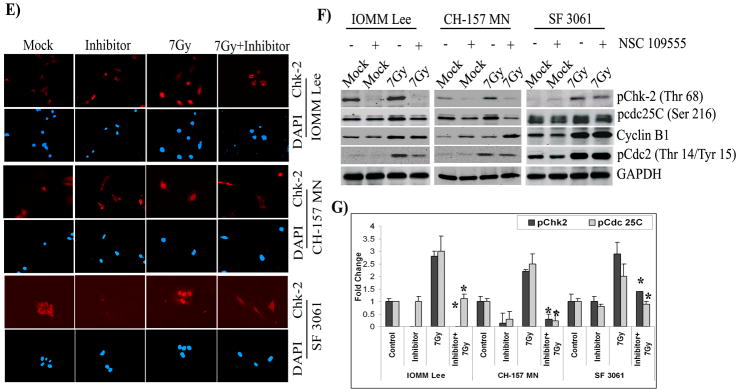
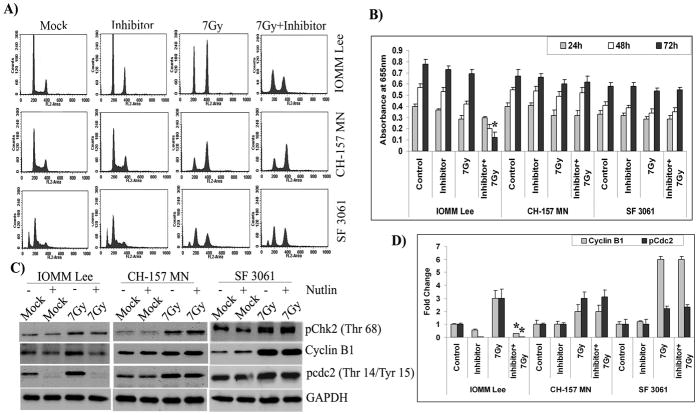
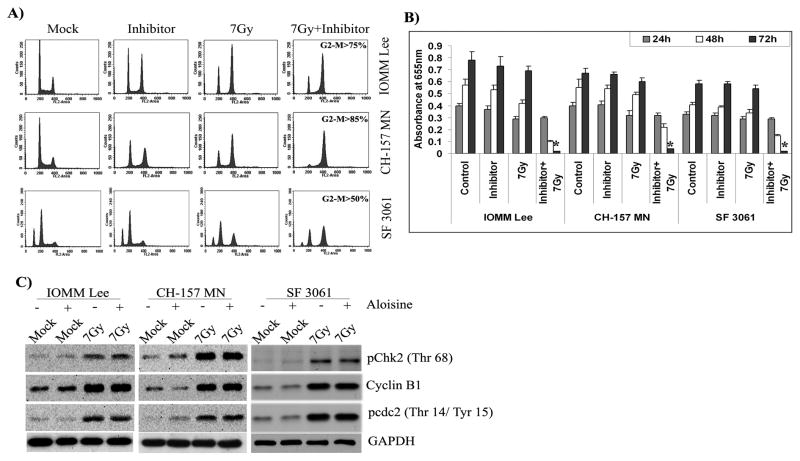
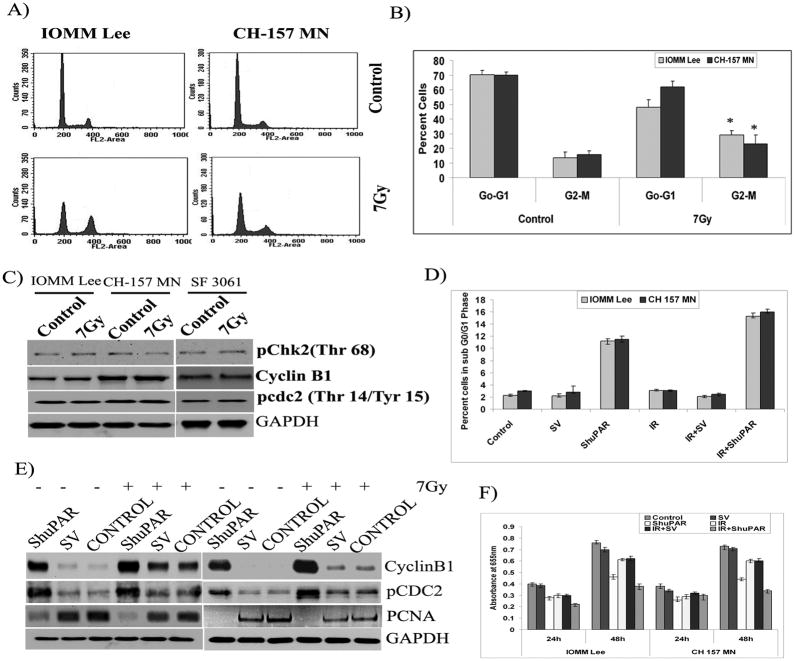
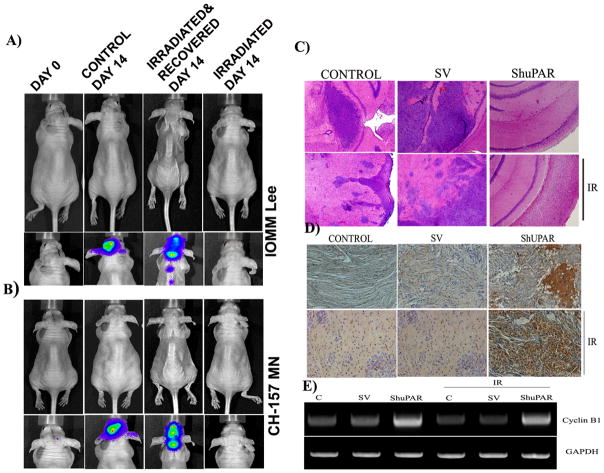
In continuation to our studies on radioresistance in meningioma, here we show that radiation treatment (7Gy) induces G2/M cell cycle arrest in meningioma cells. Phosphorylation of Chk2, Cdc25c and Cdc2 were found to be key events since interference with Chk2 activation and cyclin B1/Cdc2 interaction led to permanent arrest followed by apoptosis. Irradiated cells showed recovery and formed aggressive intracranial tumors with rapid spread and morbidity. Nevertheless, knock down of uPAR with or without radiation induced permanent arrest in G2/M phase and subsequent apoptosis in vitro and in vivo. In conclusion, our data suggest that combination treatment with radiation and uPAR knock down or other inhibitors resulting in non-reversible G2/M arrest may be beneficial in the management of meningiomas.


Conflict of interest statement

Conflict of Interest

The authors declare that there are no conflicts of interest.

Figures

Figure 1
Figure 1. Radiation treatment induces G2/M cell cycle arrest in meningioma cells
(A) IOMM Lee, CH 157 MN and SF3061 cells were irradiated with different doses of radiation (3, 5, 7 and 10 Gy). The irradiated cells were seeded (1×10⁴ cells) in 150-mm culture plates and allowed to form colonies for 24, 48 and 72 hrs. Cells were fixed and stained with Giemsa, followed by colony counting. Survival fraction was calculated and the values are means of three different experiments. (B) Cell cycle analysis of IOMM Lee, CH 157 MN and SF3061 cells treated with 7 Gy, stained with propidium iodide, and measured 24 hrs after treatment. The y axis denotes cell count and the x axis represents DNA content. The percentages of cells out of 10,000 events were calculated without gating. (C) Quantification of the distribution of cells in the G0/G1, G2/M, and S phases of the cell cycle. Data presented are means ± SEM calculated from three independent experiments.
Figure 2
Figure 2. Expression of cell cycle-related proteins in irradiated cells
(A) Western blot analysis of Chk2, phospho-Chk2, p53, Cdc25C, phospho-Cdc25C (Ser216), cyclin B1 and phospho-Cdc2 (Thr 14/Tyr15) in IOMM Lee, CH 157 MN and SF3061 cells at 24 hrs post-irradiation. GAPDH served as a loading control. (B) ImageJ quantification of the molecules in arbitrary units; each value is representative of three independent experiments. (C) Western blot analysis of cyclin B1 and pCdc2 (Thr 14/Tyr 15) at 8 and 48 hrs post-irradiation. GAPDH served as a loading control.
Figure 3
Figure 3. Chk2 inhibitor induces apoptosis in irradiated cells
(A) Cell cycle analysis of IOMM Lee, CH 157 MN and SF3061 cells treated with 10 μM inhibitor for 1 hr and/or 7 Gy radiation, stained with propidium iodide, and measured 24 hrs after treatment. The y axis denotes cell count and the x axis represents DNA content. The percentages of cells out of 10,000 events were calculated without gating. (B) Quantification of the cell distribution in the G0/G1, G2/M, and S phases of the cell cycle. Data presented are means ± SEM calculated from three independent experiments. (C) IOMM-Lee, CH 157 MN and SF3061 (1×10³) cells were treated with 10 μM inhibitor and 7 Gy radiation, incubated for 48 hrs, and stained for apoptosis using the TUNEL assay. Data shown are from representative fields. (D) Cell death was quantified as percent of apoptotic cells against controls. Values are mean ± SD from three different experiments (p<0.05). (E) Immunofluorescence microscopy for Chk2 staining patterns in the treatment groups using red Fluorophore-tagged secondary antibody. DAPI was used for nuclear staining. Each picture is representative of 15 observed fields (20X). (F) Western blot analysis of pChk2, pCdc25C, cyclin B1, and pCdc2 in the inhibitor-treated cells. GAPDH served as a loading control. Each blot is representative of three independent experiments. (G) Quantification of pChk2 and pCdc25C in the inhibitor-treated cells.
Figure 4
Figure 4. p53 acts as downstream effector to Chk2 in IOMM Lee cells
(A) Cell cycle analysis of IOMM Lee, CH 157 MN and SF3061 cells treated with 10 μM inhibitor for 1 hr and/or 7 Gy radiation, stained with propidium iodide, and measured 24 hrs after treatment. The y axis denotes cell count and the x axis represents DNA content. The percentages of cells out of 10,000 events were calculated without gating. (B) IOMM Lee, CH 157 MN and SF3061 cells (1×10⁵) were seeded in 6-well plates and irradiated. Next, cells were trypsinized and seeded at 1×10⁴ cells per well in 96-well plates. After the indicated hours of incubation, MTT reagent was added, followed by another 4 hrs of incubation and the addition of acid-isopropanol. Absorbance was measured at 550 nm and the values were quantified. (C) Western blot analysis of pChk2, cyclin B1 and pCdc2 in the inhibitor-treated cells. GAPDH served as a loading control. Each blot is a representative of three independent experiments. (D) ImageJ quantification of cyclin B1 and pCdc2 in the inhibitor-treated cells.
Figure 5
Figure 5. Cyclin B1-Cdc2 complex maintains G2/M arrest
(A) Cell cycle analysis of IOMM Lee, CH 157 MN and SF3061 cells treated with 10 μM inhibitor for 1 hr and/or 7 Gy radiation, stained with propidium iodide, and measured 24 hrs after treatment. The y axis denotes cell count and the x axis represents DNA content. The percentages of cells out of 10,000 events were calculated without gating. (B) IOMM Lee, CH 157 MN and SF3061 cells (1×10⁵) were seeded in 6-well plates and irradiated. Cells were trypsinized and seeded at 1×10⁴ cells per well in 96-well plates. After the indicated hours of incubation, MTT reagent was added, followed by another 4 hrs of incubation and the addition of acid-isopropanol. Absorbance was measured at 550 nm and the values were quantified. (C) Western blot analysis of pChk2, cyclin B1 and pCdc2 in the inhibitor-treated cells. GAPDH served as a loading control. Each blot is representative of three independent experiments.
Figure 6
Figure 6. Meningioma cells recover from radiation induced cell cycle arrest and uPAR knock down induces cell death
(A) Cell cycle analysis of IOMM Lee and CH 157 MN cells treated with 7 Gy radiation, stained with propidium iodide, and measured 72 hrs after treatment. The y axis denotes cell count and the x axis represents DNA content. The percentages of cells out of 10,000 events were calculated without gating. (B) Quantification of distribution of cells in the G0/G1 and G2/M phases of the cell cycle. Data presented are means ± SEM calculated from three independent experiments. (C) Western blot analysis of pChk2, cyclin B1 and pCdc2 at 72 hrs after irradiation. GAPDH served as a loading control. Each blot is representative of three independent experiments. (D) Cell cycle analysis of IOMM Lee and CH 157 MN cells transfected with Scrambled vector (SV), ShuPAR, irradiated (7Gy) stained with propidium iodide after 24 hrs treatment as indicated. Percentage of cells in SubG0/G1 population in each treatment group is plotted. Data presented are means ± SEM calculated from three independent experiments. E) IOMM Lee and CH 157 MN cells were transfected either with SV or ShuPAR expressing plasmids alone or in combination with radiation. After 6h radiation treatment cells were transferred into 96 well plates and MTT assay was performed at indicated period of times. Data presented are means ± SEM calculated from three independent experiments. F) Western blot analysis in transfected cells for cyclin B1 and pCdc2 at 24 hrs after irradiation. GAPDH served as a loading control. Each blot is representative of three independent experiments.
Figure 7
Figure 7. Irradiated meningioma form aggressive tumors while uPAR knock down induces sustained G2/M arrest in vivo
(A-B) IOMM Lee and CH 157 MN luciferase expressing stable cells (1×10⁵) were implanted into nude mice (4 to 6 weeks old). The first group was treated with irradiated (7 Gy) cells. The second group was infused with irradiated (7 Gy) cells that were allowed to recover. The third group was infused with non-irradiated cells. Tumor progression and morphological and behavioral patterns were followed daily for two weeks with an in vivo imaging system. (C) Representative photmicrograph (40X)of Immunohistochemistry for Cyclin B1 in the brain sections of animals implanted with transfected IOMM Lee cells in combination with radiation treatment (IR; 7Gy) as indicated (n=5). (D) H&E staining of brain sections for the visualization of tumor formation. (E) Representative image of RT-PCR analysis for Cyclin B1 in the brain tissues of different treatment groups. GAPDH served as loading control (n=3).

Similar articles

Cited by

References

    1. Alexiou GA, Gogou P, Markoula S, Kyritsis AP. Management of meningiomas. Clin Neurol Neurosurg. 2010;112:177–182. - PubMed
    1. Norden AD, Drappatz J, Wen PY. Advances in meningioma therapy. Curr Neurol Neurosci Rep. 2009;9:231–240. - PubMed
    1. Kondziolka D, Mathieu D, Lunsford LD, Martin JJ, Madhok R, Niranjan A, Flickinger JC. Radiosurgery as definitive management of intracranial meningiomas. Neurosurgery. 2008;62:53–58. - PubMed
    1. Malik I, Rowe JG, Walton L, Radatz MW, Kemeny AA. The use of stereotactic radiosurgery in the management of meningiomas. Br J Neurosurg. 2005;19:13–20. - PubMed
    1. Milker-Zabel S, Zabel-du BA, Huber P, Schlegel W, Debus J. Intensity-modulated radiotherapy for complex-shaped meningioma of the skull base: long-term experience of a single institution. Int J Radiat Oncol Biol Phys. 2007;68:858–863. - PubMed

Publication types

MeSH terms