

What are the determinants of gene expression levels and breadths in the human genome?
- PMID: 21945885
- PMCID: PMC3235009
- DOI: 10.1093/hmg/ddr436
What are the determinants of gene expression levels and breadths in the human genome?
Abstract
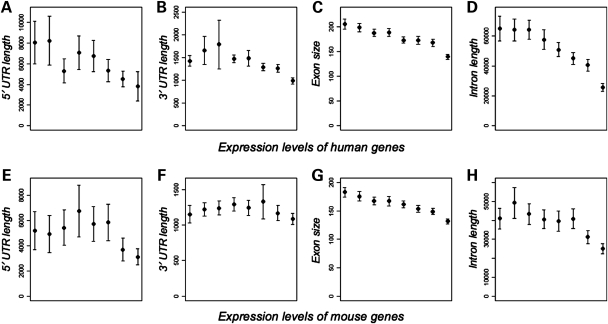
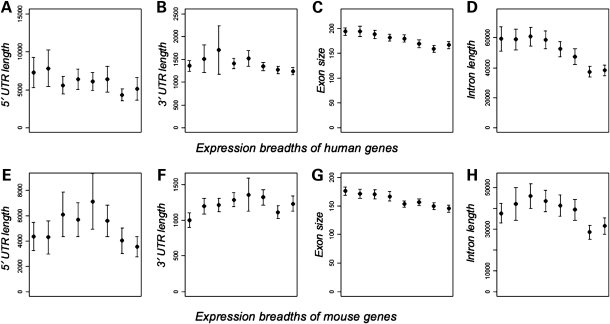
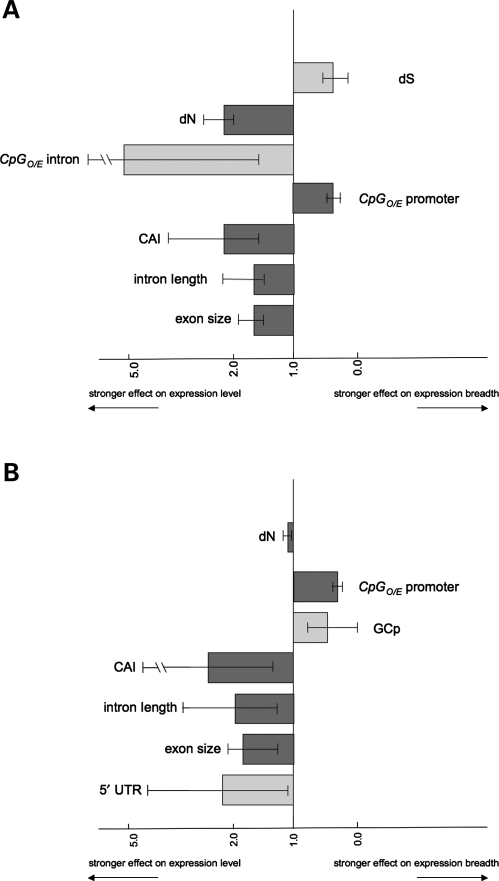
In complex organisms, different tissues express different genes, which ultimately shape the function and phenotype of each tissue. An important goal of modern biology is to understand how some genes are turned on and off in specific tissues and how the numbers of different gene expression products are determined. These aspects are named 'expression breadth' (or 'tissue specificity') and 'expression level', respectively. Here, we show that we can predict substantial amount of variation in levels and breadths of gene expression using genomic information of each gene. Interestingly, many genomic traits are correlated with both aspects of gene expression in similar directions, suggesting shared molecular pathways. However, to elucidate distinctive molecular mechanisms governing gene expression levels and breadths, we need to identify the relative significance of each genomic trait on these two aspects of gene expression. To this end, we developed a novel multivariate multiple regression method. Using this new method, we show that gene compactness (in particular, the mean size of exons), codon usage bias and non-synonymous rates have a stronger influence on expression levels compared with their effects on expression breadths. In contrast, the propensity of promoter DNA methylation is a stronger indicator of expression breadths than of expression levels. Interestingly, intron DNA methylation exhibits an opposite pattern to the promoter DNA methylation in the human genome, suggesting that DNA methylation may play multiple roles depending upon its genomic targets. Furthermore, synonymous rates have stronger associations with expression breadths than with expression levels in the human genome. These findings provide clues toward distinctive molecular mechanisms regulating different aspects of gene expression.
Figures
References
-
- King M.-C., Wilson A.C. Evolution at two levels in humans and chimpanzees. Science. 1975;188:107–116. - PubMed
-
- Drummond D.A., Raval A., Wilke C.O. A single determinant dominates the rate of yeast protein evolution. Mol. Biol. Evol. 2006;23:327–337. - PubMed
-
- Lopez-Maury L., Marguerat S., Bahler J. Tuning gene expression to changing environments: from rapid responses to evolutionary adaptation. Nat. Rev. Genet. 2008;9:583–593. - PubMed
-
- Eisenberg E., Levanon E. Human housekeeping genes are compact. Trends Genet. 2003;19:362–365. - PubMed
