

Progression of tau pathology in cholinergic Basal forebrain neurons in mild cognitive impairment and Alzheimer's disease
- PMID: 21945902
- PMCID: PMC3204017
- DOI: 10.1016/j.ajpath.2011.07.044
Progression of tau pathology in cholinergic Basal forebrain neurons in mild cognitive impairment and Alzheimer's disease
Abstract
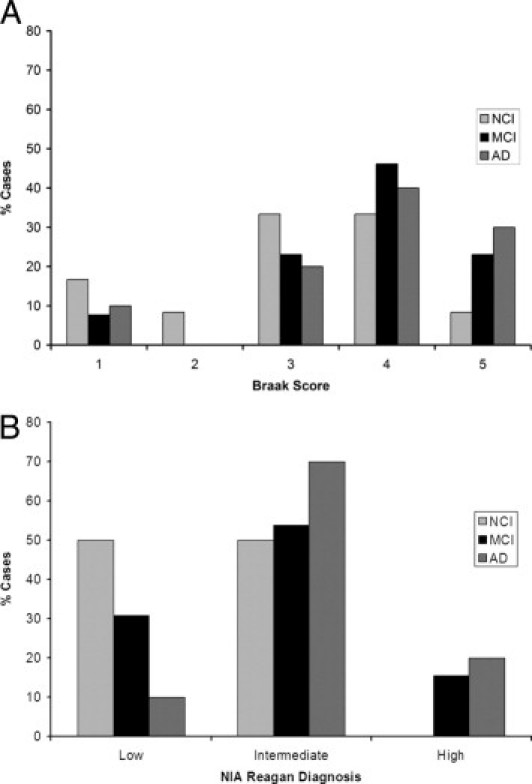
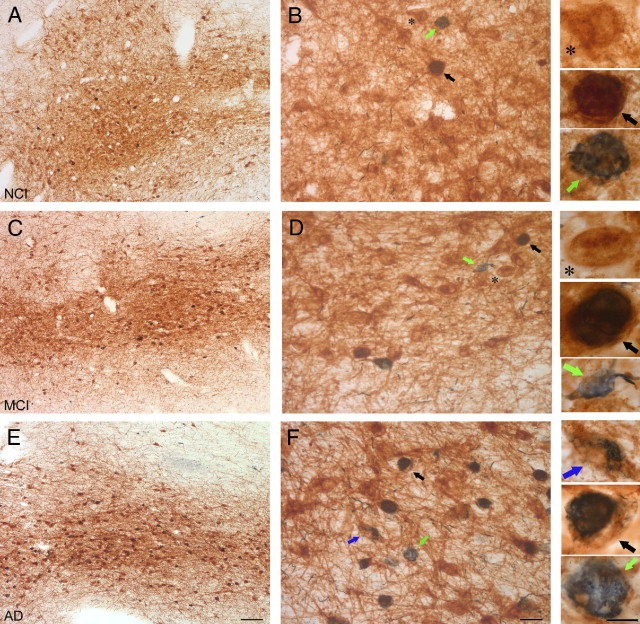
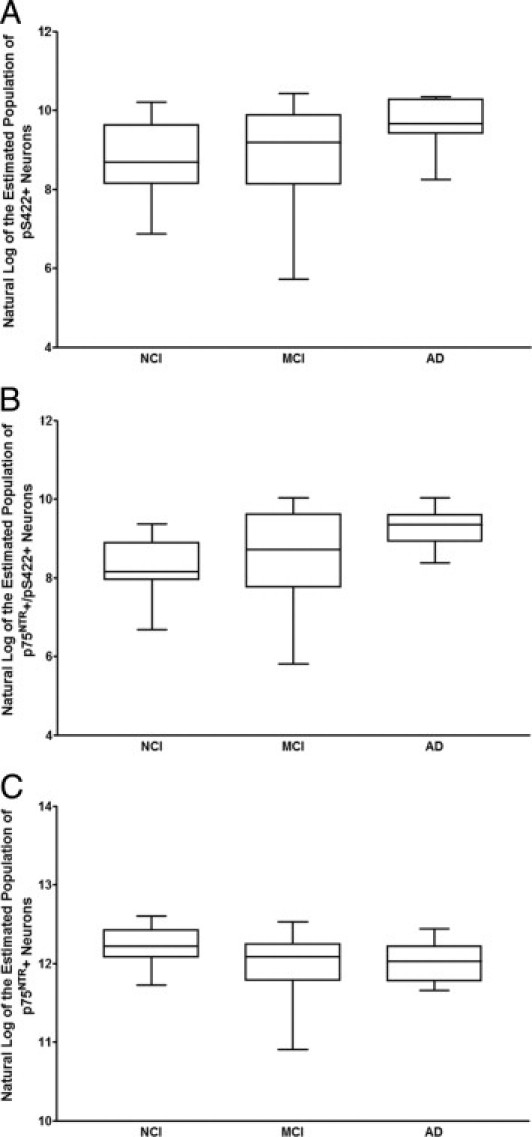
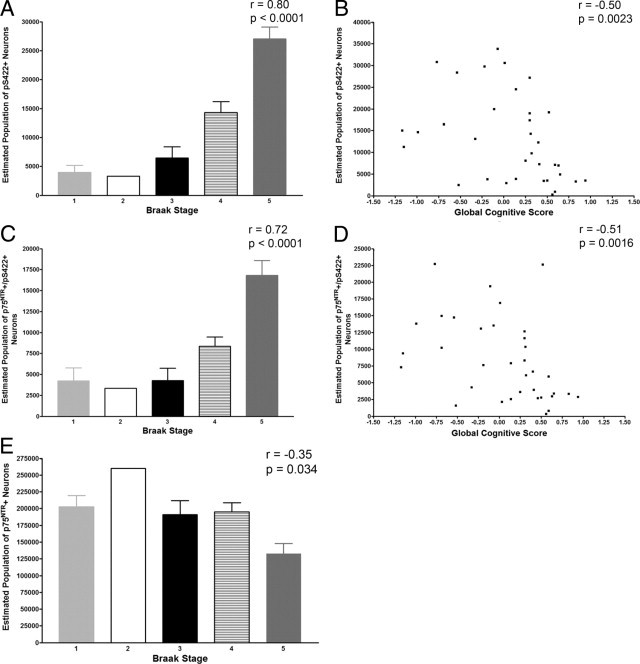
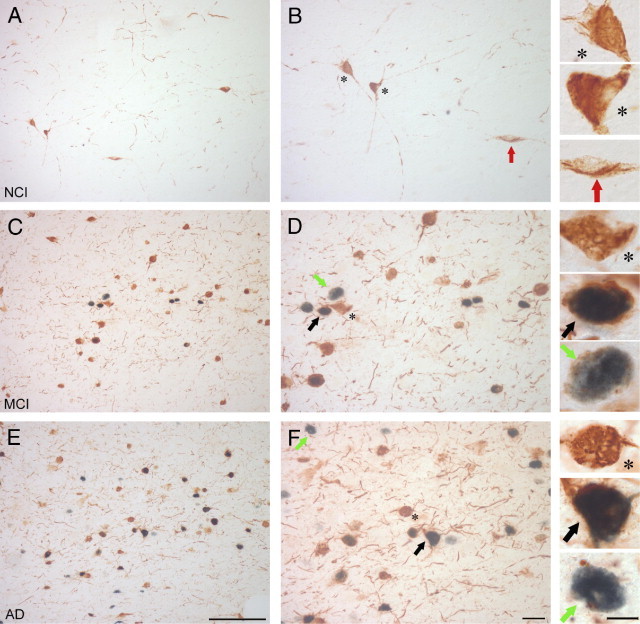
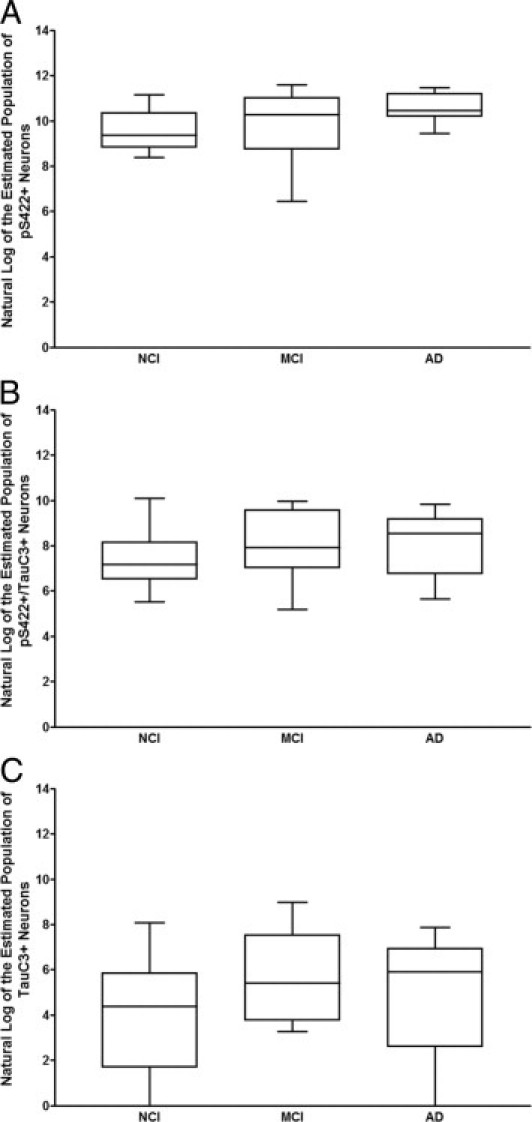
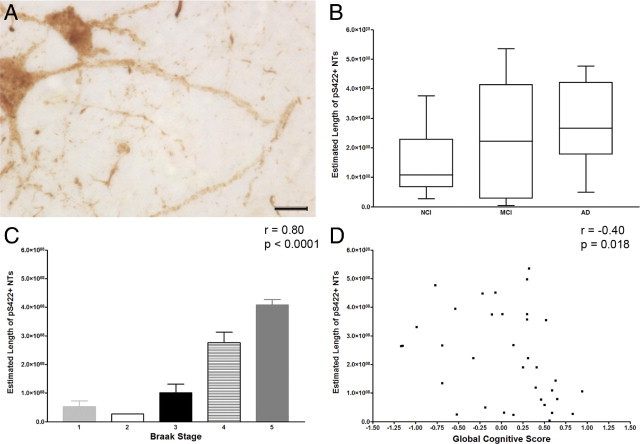
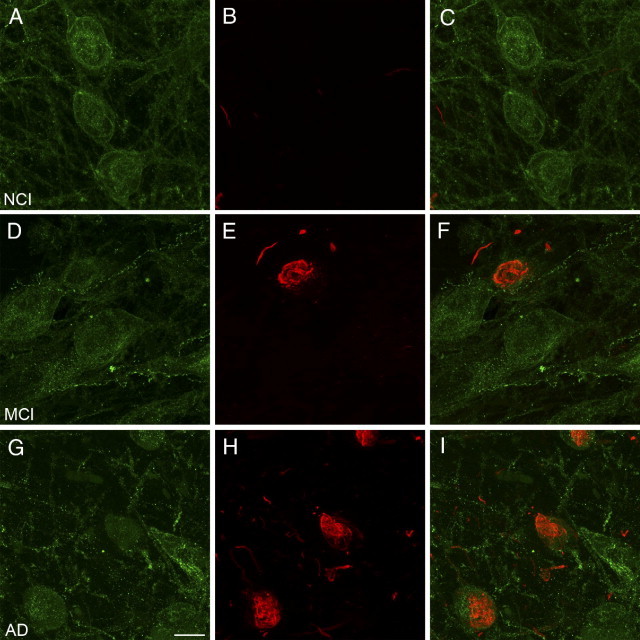
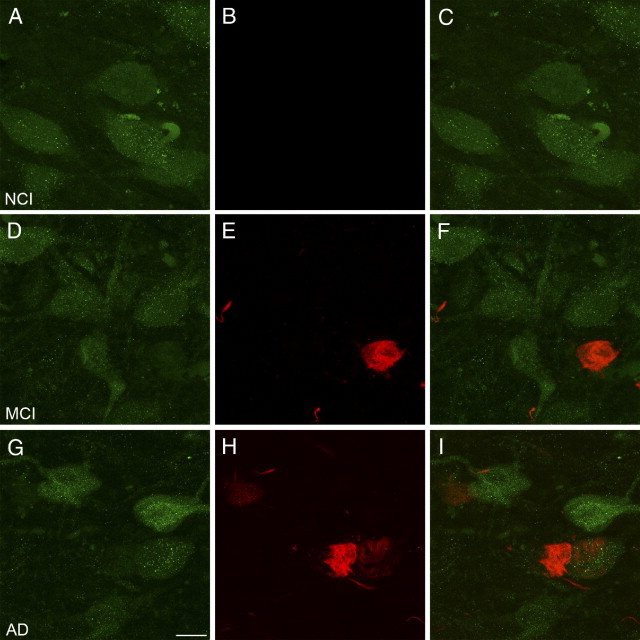
Tau is a microtubule-associated protein that forms neurofibrillary tangles (NFTs) in the selective vulnerable long projection neurons of the cholinergic basal forebrain (CBF) in Alzheimer's disease (AD). Although CBF neurodegeneration correlates with cognitive decline during AD progression, little is known about the temporal changes of tau accumulation in this region. We investigated tau posttranslational modifications during NFT evolution within the CBF neurons of the nucleus basalis (NB) using tissue from subjects with no cognitive impairment, mild cognitive impairment, and AD. The pS422 antibody was used as an early tau pathology marker that labels tau phosphorylated at Ser422; the TauC3 antibody was used to detect later stage tau pathology. Stereologic evaluation of NB tissue immunostained for pS422 and TauC3 revealed an increase in neurons expressing these tau epitopes during disease progression. We also investigated the occurrence of pretangle tau events within cholinergic NB neurons by dual staining for the cholinergic cell marker, p75(NTR), which displays a phenotypic down-regulation within CBF perikarya in AD. As pS422+ neurons increased in number, p75(NTR)+ neurons decreased, and these changes correlated with both AD neuropathology and cognitive decline. Also, NFTs developed slower in the CBF compared with previously examined cortical regions. Taken together, these results suggest that changes in cognition are associated with pretangle events within NB cholinergic neurons before frank NFT deposition.
Copyright © 2011 American Society for Investigative Pathology. Published by Elsevier Inc. All rights reserved.
Figures
Comment in
-
The earliest tau dysfunction in Alzheimer's disease? Tau phosphorylated at s422 as a toxic seed.Am J Pathol. 2011 Nov;179(5):2148-51. doi: 10.1016/j.ajpath.2011.08.020. Epub 2011 Sep 28. Am J Pathol. 2011. PMID: 21964186 Free PMC article.
Similar articles
-
Pretangle pathology within cholinergic nucleus basalis neurons coincides with neurotrophic and neurotransmitter receptor gene dysregulation during the progression of Alzheimer's disease.Neurobiol Dis. 2018 Sep;117:125-136. doi: 10.1016/j.nbd.2018.05.021. Epub 2018 May 31. Neurobiol Dis. 2018. PMID: 29859871 Free PMC article.
-
Protein homeostasis gene dysregulation in pretangle-bearing nucleus basalis neurons during the progression of Alzheimer's disease.Neurobiol Aging. 2016 Jun;42:80-90. doi: 10.1016/j.neurobiolaging.2016.02.031. Epub 2016 Mar 8. Neurobiol Aging. 2016. PMID: 27143424 Free PMC article.
-
HDAC2 dysregulation in the nucleus basalis of Meynert during the progression of Alzheimer's disease.Neuropathol Appl Neurobiol. 2019 Jun;45(4):380-397. doi: 10.1111/nan.12518. Epub 2018 Oct 28. Neuropathol Appl Neurobiol. 2019. PMID: 30252960 Free PMC article.
-
Human cholinergic basal forebrain: chemoanatomy and neurologic dysfunction.J Chem Neuroanat. 2003 Dec;26(4):233-42. doi: 10.1016/s0891-0618(03)00068-1. J Chem Neuroanat. 2003. PMID: 14729126 Review.
-
The cholinergic system in aging and neuronal degeneration.Behav Brain Res. 2011 Aug 10;221(2):555-63. doi: 10.1016/j.bbr.2010.11.058. Epub 2010 Dec 9. Behav Brain Res. 2011. PMID: 21145918 Review.
Cited by
-
Axonal degeneration in Alzheimer's disease: when signaling abnormalities meet the axonal transport system.Exp Neurol. 2013 Aug;246:44-53. doi: 10.1016/j.expneurol.2012.06.003. Epub 2012 Jun 19. Exp Neurol. 2013. PMID: 22721767 Free PMC article. Review.
-
Small molecule p75NTR ligand prevents cognitive deficits and neurite degeneration in an Alzheimer's mouse model.Neurobiol Aging. 2013 Aug;34(8):2052-63. doi: 10.1016/j.neurobiolaging.2013.02.015. Epub 2013 Mar 29. Neurobiol Aging. 2013. PMID: 23545424 Free PMC article.
-
Tau as a therapeutic target in neurodegenerative disease.Pharmacol Ther. 2012 Oct;136(1):8-22. doi: 10.1016/j.pharmthera.2012.07.001. Epub 2012 Jul 10. Pharmacol Ther. 2012. PMID: 22790092 Free PMC article. Review.
-
Alzheimer's Disease-Related Phospho-Tau181 Signals Are Localized to Demyelinated Axons of Parvalbumin-Positive GABAergic Interneurons in an App Knock-In Mouse Model of Amyloid-β Pathology.J Alzheimers Dis. 2023;93(3):1065-1081. doi: 10.3233/JAD-230121. J Alzheimers Dis. 2023. PMID: 37212118 Free PMC article.
-
Alzheimer's disease: from early pathogenesis to novel therapeutic approaches.Metab Brain Dis. 2024 Aug;39(6):1231-1254. doi: 10.1007/s11011-024-01389-6. Epub 2024 Jul 24. Metab Brain Dis. 2024. PMID: 39046584 Review.
References
-
- Mesulam M.M., Mufson E.J., Levey A.I., Wainer B.H. Cholinergic innervation of cortex by the basal forebrain: cytochemistry and cortical connections of the septal area, diagonal band nuclei, nucleus basalis (substantia innominata), and hypothalamus in the rhesus monkey. J Comp Neurol. 1983;214:170–197. - PubMed
-
- Mesulam M.M., Geula C. Nucleus basalis (Ch4) and cortical cholinergic innervation in the human brain: observations based on the distribution of acetylcholinesterase and choline acetyltransferase. J Comp Neurol. 1988;275:216–240. - PubMed
-
- Wilcock G.K., Esiri M.M. Plaques, tangles and dementia: A quantitative study. J Neurol Sci. 1982;56:343–356. - PubMed
-
- Bierer L.M., Haroutunian V., Gabriel S., Knott P.J., Carlin L.S., Purohit D.P., Perl D.P., Schmeidler J., Kanof P., Davis K.L. Neurochemical correlates of dementia severity in Alzheimer's disease: relative importance of the cholinergic deficits. J Neurochem. 1995;64:749–760. - PubMed
-
- Whitehouse P.J., Price D.L., Struble R.G., Clark A.W., Coyle J.T., Delon M.R. Alzheimer's disease and senile dementia: loss of neurons in the basal forebrain. Science. 1982;215:1237–1239. - PubMed
Publication types
MeSH terms
Substances
Grants and funding
LinkOut - more resources
Full Text Sources
Other Literature Sources
Medical
Research Materials
