Comparative Study
. 2011 Oct;121(10):4170-9.
doi: 10.1172/JCI59255. Epub 2011 Sep 26.

Gene expression profiling of CD8+ T cells predicts prognosis in patients with Crohn disease and ulcerative colitis

Affiliations
Comparative Study

Gene expression profiling of CD8+ T cells predicts prognosis in patients with Crohn disease and ulcerative colitis

James C Lee et al. J Clin Invest. 2011 Oct.

Abstract

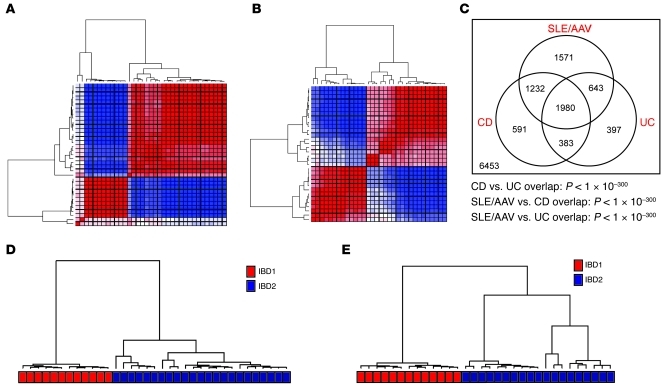
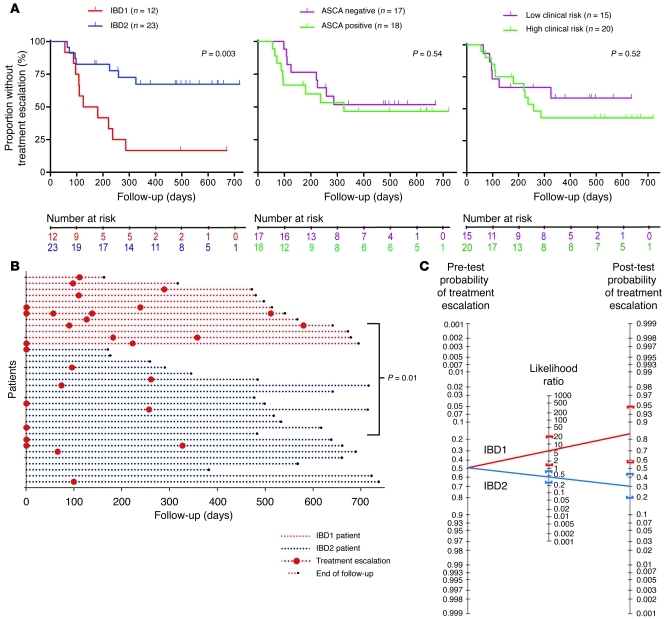
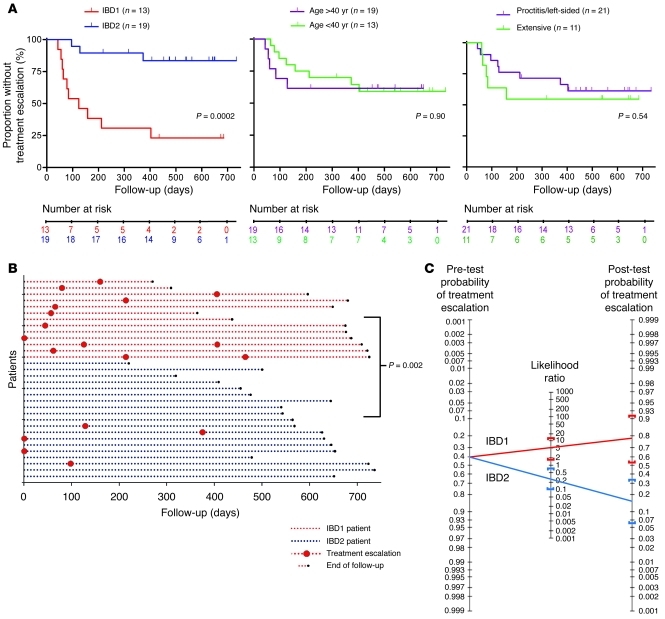
Crohn disease (CD) and ulcerative colitis (UC) are increasingly common, chronic forms of inflammatory bowel disease. The behavior of these diseases varies unpredictably among patients. Identification of reliable prognostic biomarkers would enable treatment to be personalized so that patients destined to experience aggressive disease could receive appropriately potent therapies from diagnosis, while those who will experience more indolent disease are not exposed to the risks and side effects of unnecessary immunosuppression. Using transcriptional profiling of circulating T cells isolated from patients with CD and UC, we identified analogous CD8+ T cell transcriptional signatures that divided patients into 2 otherwise indistinguishable subgroups. In both UC and CD, patients in these subgroups subsequently experienced very different disease courses. A substantially higher incidence of frequently relapsing disease was experienced by those patients in the subgroup defined by elevated expression of genes involved in antigen-dependent T cell responses, including signaling initiated by both IL-7 and TCR ligation - pathways previously associated with prognosis in unrelated autoimmune diseases. No equivalent correlation was observed with CD4+ T cell gene expression. This suggests that the course of otherwise distinct autoimmune and inflammatory conditions may be influenced by common pathways and identifies what we believe to be the first biomarker that can predict prognosis in both UC and CD from diagnosis, a major step toward personalized therapy.


Figures

Figure 1
Figure 1. Overlapping CD8 T cell gene expression signatures divide patients with CD and UC into 2 distinct subgroups.
Consensus clustering heat maps, demonstrating the merged output of 5,000 iterations of hierarchical and k-means clustering of (A) patients with CD and (B) patients with UC. Patient samples are arranged in the same order along the x and y axes. The colors of the intersecting squares represent the frequency with which samples cluster together, both within individual consensus clustering analyses and also between analyses using different methods of clustering. The color ranges from red (patients always cluster together) to blue (patients never cluster together). (C) Venn diagram illustrating the overlap between the gene signatures that distinguish the respective subgroups in CD, UC, and SLE/AAV (15). The statistical significance of each overlap was determined using a hypergeometric test. Numbers in the diagram refer to numbers of genes. Those inside the circles refer to the genes that are within each respective signature. The number outside the circles refers to the remaining genes expressed in CD8 T cells, which were not differentially expressed in any of the signatures. (D) The clusters of CD patients that were produced by k-means clustering for this cohort using the gene signature generated in the UC patients and (E) vice versa. The colored bar beneath each dendrogram corresponds to the original IBD1/2 subgroup membership.
Figure 2
Figure 2. CD patients in subgroups IBD1 and IBD2 have significantly different disease courses.
(A) Kaplan-Meier survival curves demonstrating the proportion of CD patients who did not require a subsequent treatment escalation (immunomodulator or surgery) after enrollment, as stratified by IBD1/2 subgroup (left) and ASCA serology (middle) and clinical parameters associated with complicated disease (right). Clinical parameters included age of less than 40 years at diagnosis, initial requirement for steroids, and perianal involvement. High risk of complicated disease was defined as 2 or more of these parameters; low risk was defined as fewer than 2 of these parameters. Statistical significance was determined using a log-rank test (df). Number at risk refers to the number of uncensored patients at each time point who remained at risk of requiring a treatment escalation. (B) Disease courses of all CD patients (y axis). The color of dotted lines reflects subgroup designation. In cases in which multiple treatment escalations are indicated, this universally reflects ongoing disease activity rather than intolerance to the initial treatment. Statistical significance was determined using a Fisher’s exact test (2 df). (C) Bayes’ nomogram demonstrating the effect that stratifying the CD cohorts by the IBD1/2 signature would have had upon the predicted requirement for treatment escalation: prior probability of treatment escalation, 48.6%; positive likelihood ratio, (sensitivity/[1-specificity]) 5.29 (95% CI, 1.35–21); negative likelihood ratio, ([1-sensitivity]/specificity) 0.46 (95% CI, 0.26–0.84); post-test probabilities, IBD1, 83% (95% CI, 56%–95%), and IBD2, 30% (95% CI, 20%–44%).
Figure 3
Figure 3. UC patients in subgroups IBD1 and IBD2 also have significantly different disease courses.
(A) Kaplan-Meier survival curves demonstrating the proportion of UC patients who did not require a subsequent treatment escalation (immunomodulator or surgery) after enrollment as stratified by IBD1/2 subgroup (left), age at diagnosis (middle), and disease extent (right). Statistical significance was determined using a log-rank test (1 df). Number at risk refers to the number of uncensored patients at each time point who remained at risk of requiring a treatment escalation. (B) Disease courses of all UC patients (y axis). Format is identical to that used in Figure 2B. Statistical significance was determined using a Fisher’s exact test (2 df). (C) Bayes’ nomogram demonstrating the effect that stratifying the UC cohorts by the IBD1/2 signature would have had upon the predicted requirement for treatment escalation: prior probability of treatment escalation, 40.6%; positive likelihood ratio, 4.87 (95% CI, 1.65–14); negative likelihood ratio, 0.27 (95% CI, 0.10–0.75); post-test probabilities, IBD1, 77% (95% CI, 53%–91%), and IBD2, 16% (95% CI, 6%–34%).

Comment in

References

    1. Lakatos PL. Recent trends in the epidemiology of inflammatory bowel diseases: up or down? World J Gastroenterol. 2006;12(38):6102–6108. - PMC - PubMed
    1. Jess T, et al. Changes in clinical characteristics, course, and prognosis of inflammatory bowel disease during the last 5 decades: a population-based study from Copenhagen, Denmark. Inflamm Bowel Dis. 2007;13(4):481–489. doi: 10.1002/ibd.20036. - DOI - PubMed
    1. Solberg IC, et al. Clinical course in Crohn’s disease: results of a Norwegian population-based ten-year follow-up study. Clin Gastroenterol Hepatol. 2007;5(12):1430–1438. doi: 10.1016/j.cgh.2007.09.002. - DOI - PubMed
    1. D’Haens G, et al. Early combined immunosuppression or conventional management in patients with newly diagnosed Crohn’s disease: an open randomised trial. Lancet. 2008;371(9613):660–667. doi: 10.1016/S0140-6736(08)60304-9. - DOI - PubMed
    1. D’Haens G. Top-down therapy for IBD: rationale and requisite evidence. Nat Rev Gastroenterol Hepatol. 2010;7(2):86–92. doi: 10.1038/nrgastro.2009.222. - DOI - PubMed

Publication types