. 2011 Nov;12(11):1045-54.
doi: 10.1031/ni.2131.

Innate lymphoid cells promote lung-tissue homeostasis after infection with influenza virus

Affiliations

Innate lymphoid cells promote lung-tissue homeostasis after infection with influenza virus

Laurel A Monticelli et al. Nat Immunol. 2011 Nov.

Abstract

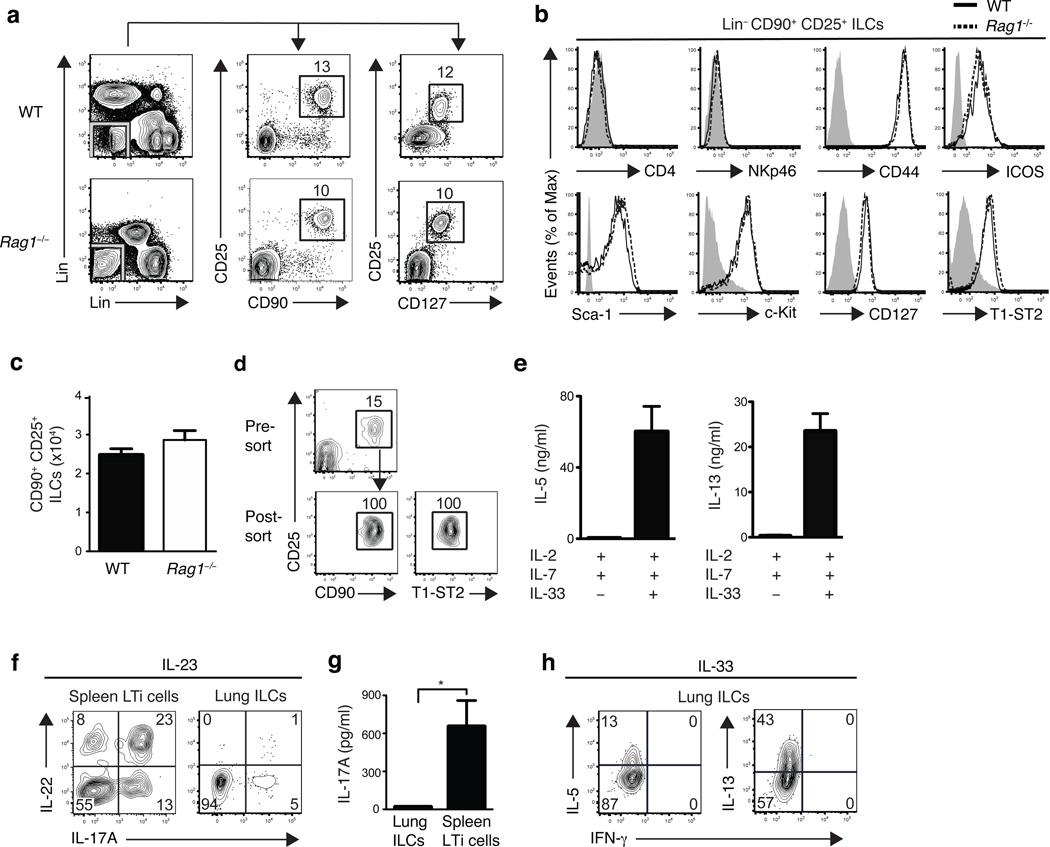
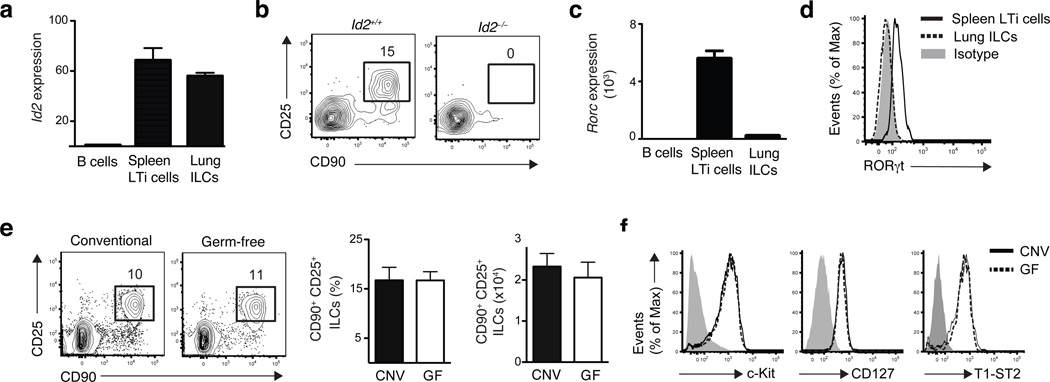
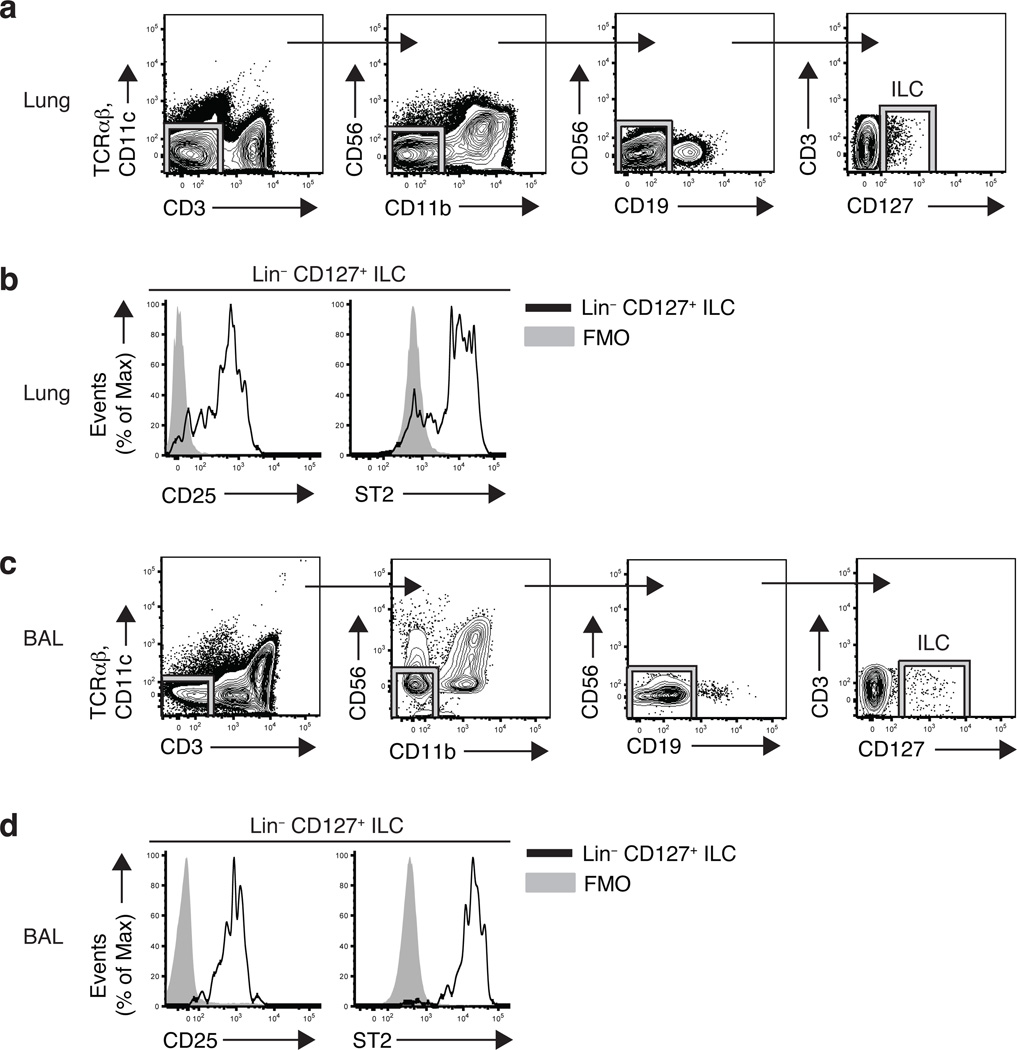
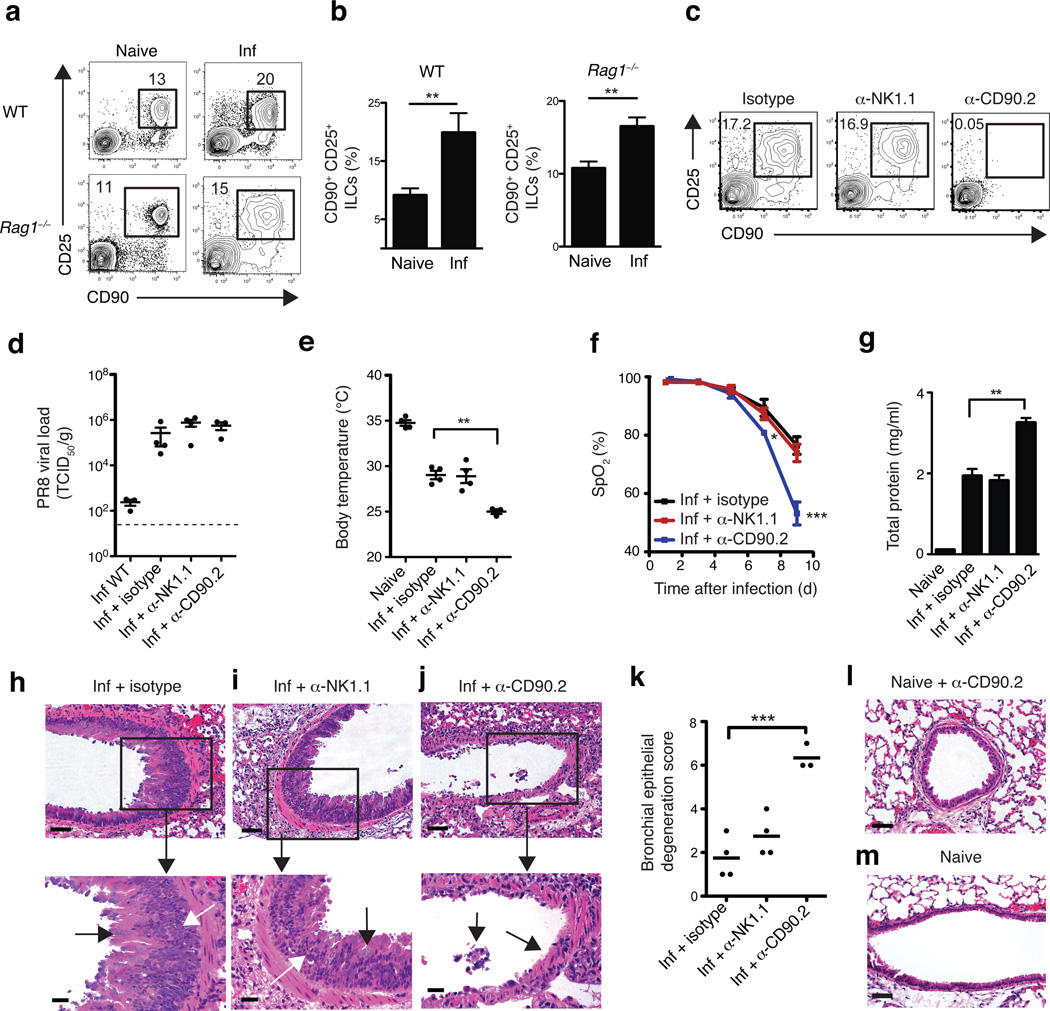
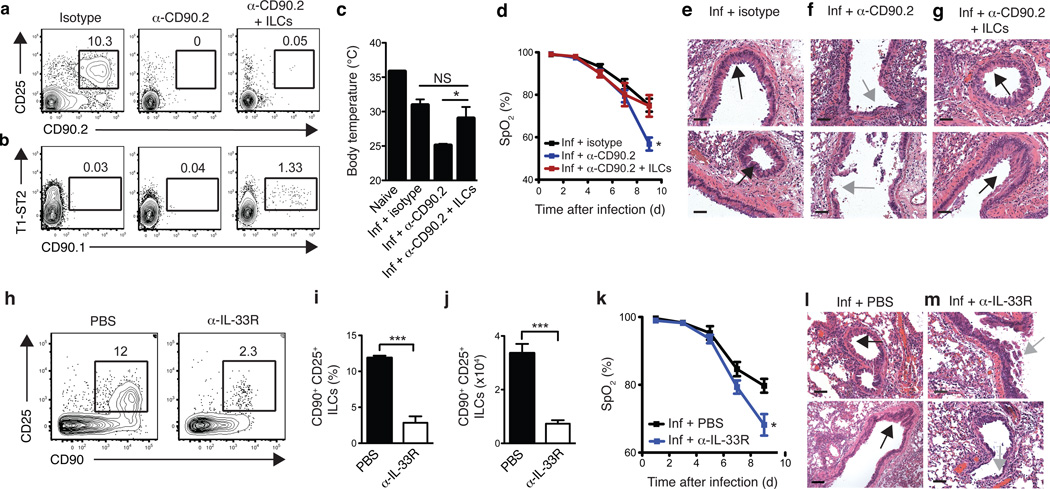
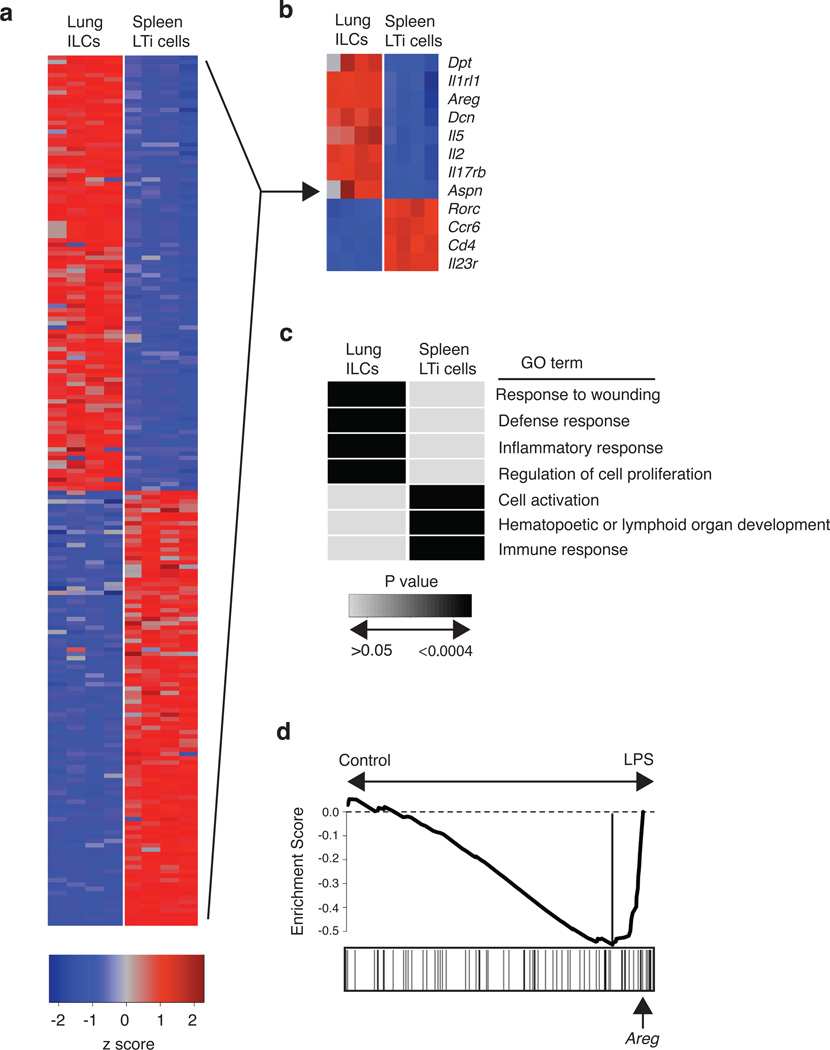
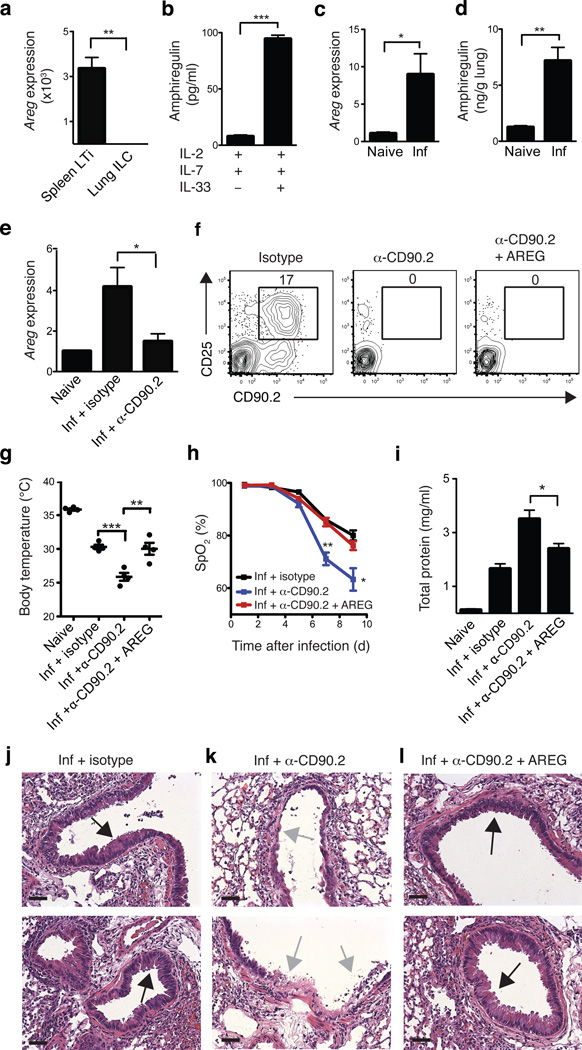
Innate lymphoid cells (ILCs), a heterogeneous cell population, are critical in orchestrating immunity and inflammation in the intestine, but whether ILCs influence immune responses or tissue homeostasis at other mucosal sites remains poorly characterized. Here we identify a population of lung-resident ILCs in mice and humans that expressed the alloantigen Thy-1 (CD90), interleukin 2 (IL-2) receptor a-chain (CD25), IL-7 receptor a-chain (CD127) and the IL-33 receptor subunit T1-ST2. Notably, mouse ILCs accumulated in the lung after infection with influenza virus, and depletion of ILCs resulted in loss of airway epithelial integrity, diminished lung function and impaired airway remodeling. These defects were restored by administration of the lung ILC product amphiregulin. Collectively, our results demonstrate a critical role for lung ILCs in restoring airway epithelial integrity and tissue homeostasis after infection with influenza virus.


Figures

Figure 1
Figure 1. ILCs in the lung resemble nuocytes and NHCs in phenotype and cytokine profile
(a) Identification of lung ILCs in C57BL/6 wild-type (WT) and Rag1−/− mice by flow cytometry as CD90+ CD25+ CD127+ lineage (Lin) negative cells lacking expression of the follow markers: (CD3, CD5, NK1.1, CD27, TCRβ antibodies on the y-axis, B220, CD11b, CD11c antibodies on the x-axis). (b) Expression of cell surface markers on Lin CD90+ CD25+ lung ILCs in C57BL/6 WT (solid black line) and Rag1−/− mice (dashed black line) compared to isotype controls (gray shaded). (a-b) Data is representative of more than three experiments, n = at least 4 WT or Rag1−/− mice. (c) Absolute number of CD90+ CD25+ ILCs in naïve WT or Rag1−/− lung. d) Flow cytometry plots of pre-sort and post-sort purity of CD90+ CD25+ T1-ST2+ WT lung ILCs, gated on live, lineage negative cells. (e) IL-5 and IL-13 cytokine secretion from flow sorted CD90+ CD25+ T1-ST2+ lung ILCs cultured with IL-2 + IL-7 alone or in combination with IL-33 for four days, measured by ELISA. Data is representative of three independent experiments, n = 3 replicates, each replicate consisting of ILCs sorted from 5 pooled lungs. (f) Intracellular cytokine staining for IL-22 and IL-17A in Lin CD90+ CD25+ lung ILCs or spleen CD90+ CD4+ LTi cells from WT mice, stimulated with 50 ng/ml rIL-23 (12 h) + PMA and Ionomycin (4 h). (g) IL-17A cytokine secretion from flow sorted CD90+ CD25+ T1-ST2+ lung ILCs or spleen CD90+ CD4+ LTi cells cultured with IL-2 + IL-7 alone or in combination with IL-23 for four days, measured by ELISA. Data is representative of two independent experiments, n = 3 replicates, each replicate consisting of ILCs sorted from 3 pooled lungs or spleens. (h) Intracellular cytokine staining in Lin CD90+ CD25+ lung ILCs from WT mice treated with 500 ng rIL-33 for 7 days in vivo and stimulated with PMA + Ionomycin (4 hours) ex vivo. (f,h) Data is representative of 2 or more experiments, n = 3–4 mice.
Figure 2
Figure 2. Development of lung ILCs requires Id2 but is independent of microbial signals
(a,c) mRNA expression of Id2 (a) or RORc (c) in sort purified Lin CD90+ CD25+ lung ILCs and Lin CD90+ CD4+ splenic LTi cells, normalized to β-actin and shown relative to expression levels in purified B220+ B cells. n = 3 replicates, each replicate consisting of spleens (LTi cells) or lungs (ILCs) pooled from 5 C57BL/6 WT mice. (b) Flow cytometry plots of CD90+ CD25+ lung ILCs in WT or Id2-deficient bone marrow chimeras sacrificed 10 weeks post reconstitution, gated on live Lin donor cells. Data is representative of 3 experiments, n = 2–4 Id2+/+ or Id2−/− chimeras. (d) Flow cytometry plot of RORγt expression in CD90+ CD25+ lung ILCs (dashed black line) or CD90+ CD4+ LTi cells (solid black line) compared to isotype antibody control (gray shaded). (e) Representative flow cytometry plots, total frequency, and absolute cell number of lung Lin CD90+ CD25+ ILCs in conventional C57BL/6 (CNV) or germ-free (GF) mice. (f) Cell surface expression of c-kit, CD127, and T1-ST2 on Lin CD90+ CD25+ lung ILCs in CNV (solid black line) or GF (dashed black line) mice compared to isotype controls (gray shaded). (e-f) Data is representative of 2 independent experiments. Data shown are the mean ± SEM, n = 3–5 CNV or GF mice.
Figure 3
Figure 3. Lin CD127+ CD25+ ST2+ ILCs in human lung and airways
(a,c) Flow cytometric gating strategy for identifying CD127+ Lin ILCs (CD3 TCRαβ CD11c CD11b CD19 CD56) in human lung parenchyma tissue (lower lobe) (a) or bronchoalveolar lavage (BAL) fluid (c), plots gated on live cells. (b,d) Expression of CD25 and ST2 on lineage negative CD127+ human lung parenchyma cells (b) and BAL cells (d) (black line) compared to FMO controls (gray shaded). FMO = fluorescence minus one. For examination of human BAL, data shown is representative of 7 of 9 lung transplant recipient patients examined. Data from lung parenchyma is representative of four cadaver tissue donors.
Figure 4
Figure 4. Depletion of CD90+ ILCs during influenza infection results in reduced lung function, compromised epithelial integrity and impaired airway remodeling
Representative flow cytometry plots (a) and frequency (b) of Lin CD90+ CD25+ ILCs in the lung parenchyma of naïve or intranasally infected (0.5 LD50 PR8) C57BL/6 WT mice (day 16 p.i.) and Rag1−/− mice (day 10 p.i.). (c-k) Rag1−/− mice were infected with 0.5 LD50 PR8 i.n. on D0 and treated with 200 µg of isotype, anti-NK1.1, or anti-CD90.2 mAb i.p. on D-1, D2, D5 and D8 p.i. and sacrificed day 10 p.i. (c) Representative flow cytometry plots of Lin CD90+ CD25+ ILCs in the lungs of antibody-treated Rag1−/− at day 10 p.i. (d) PR8 viral copies per gram of lung tissue at day 10 p.i. from infected, untreated WT mice or from infected, antibody-treated Rag1−/− mice, measured by quantitative PCR and expressed as TCID50 per gram, dashed line = limit of detection. (e) Body temperature measured in naïve mice and infected Rag1−/− at day 10 p.i. (f) Percentage blood oxygen saturation (SpO2) over the course of PR8 infection. (g) Quantification of total protein present in the bronchoalveolar lavage (BAL) fluid at day 10 p.i., (h-j) H&E staining of lung tissue from PR8-infected isotype (h), anti-NK1.1 (i), or anti-CD90.2 (j) treated Rag1−/− mice, day 10 p.i. Scale bar, 50 µm. (h,i) Black arrows indicate goblet cell hyperplasia and white arrows indicate epithelial cell hyperplasia. (j) Black arrows denote regions of epithelial shedding/necrosis within the bronchioles. (k) Histological score of respiratory epithelial degeneration. H&E stained lung sections from day 10 p.i. PR8-infected antibody-treated Rag1−/− mice were blindly graded on a scale of 0–10 for degree of bronchial/bronchiolar epithelial degeneration and necrosis. (l-m) H&E staining of lung tissue from anti-CD90.2 treated naive mice (l) and untreated naive mice (m). Scale bar = 50 µm. (a-m) Data is representative of 3 or more independent experiments n = 3–4 mice per group. Data shown are the mean ± SEM. * P < 0.05, ** P < 0.01, *** P < 0.001.
Figure 5
Figure 5. Adoptive transfer of lung-resident ILCs promotes tissue remodeling in anti-CD90.2-depleted mice while blockade of IL-33R signaling impairs lung function and airway repair
(a-g) Rag1−/− mice were infected with 0.5 LD50 PR8 i.n. on D0 and treated with 200 µg of isotype or anti-CD90.2 mAb i.p. on D-1, D2, D5, and D8 p.i. and sacrificed day 10 p.i. One group of anti-CD90.2-treated mice also received 1 × 10⁵ FACS-sorted Lin CD90.1+ CD25+ T1/ST2+ lung ILCs i.v. at D0 and D5 p.i. (a-b) Flow cytometry plots of endogenous Lin CD90.2+ CD25+ ILCs (a) and donor Lin CD90.1+ T1/ST2+ ILCs (b) in the lungs of antibody-treated Rag1−/− at day 10 p.i.. (c) Body temperature measured in naïve mice and infected Rag1−/− at day 10 p.i. (d) Percentage blood oxygen saturation (SpO2) over the course of PR8 infection. (e-g) H&E staining of lung tissue from PR8-infected isotype (e), anti-CD90.2 (f), or anti-CD90.2 + CD90.1 lung ILCs (g) treated Rag1−/− mice, day 10 p.i. Scale bar, 50 µm. Black arrows indicate epithelial cell hyperplasia and gray arrows denote regions of epithelial shedding/necrosis within the bronchioles. Scale bar = 50 µm. (a-g) Data is representative of 2 independent experiments n = 3–4 mice per group. (h-m) C57BL/6 WT mice received 200 µg anti-IL-33R (ST2) mAb or PBS every 3 days following infection with 0.5 LD50 PR8. Representative flow cytometry plots (h) and frequency and cell number (i,j) of CD90+ CD25+ ILCs in the lung of antibody-treated WT mice at 10 days p.i. (k) Pulse oximetry measurement of blood oxygen saturation levels. (l-m) H&E staining of lung tissue from PR8-infected PBS-treated mice (l) or anti-IL-33R-treated mice (m) at day 10 p.i. Black arrows indicate epithelial cell hyperplasia and gray arrows denote regions of epithelial shedding/necrosis within the bronchioles. Scale bar = 100 µm. Data is representative of 3 independent experiments n = 3–4 mice per group. Data shown are the mean ± SEM. * P < 0.05, ** P < 0.01, *** P < 0.001.
Figure 6
Figure 6. Global gene expression profiling of lung-resident ILCs reveals strong enrichment for genes regulating wound healing pathways
(a-d) CD90+ CD25+ ILCs and CD90+ CD4+ LTi cells were FACS-sorted from the lung (ILCs) or spleen (LTi cells) of naïve C57BL/6 WT mice. mRNA was isolated, amplified, and hybridized to Affymetrix gene chips for microarray analysis. (a) Heat map representing gene expression profiles of the top 100 differentially expressed genes in lung ILCs versus spleen LTi cells. Red = high expression, blue = low expression. (b) Heat map of key genes highly expressed in lung ILCs or spleen LTi cells. Red = high expression, blue = low expression (c) Gene expression signatures of ILC and LTi cells (genes differentially expressed by two-fold or greater) were examined using Database for Annotation, Visualization and Integrated Discovery (DAVID) to identify enriched Gene Ontology terms describing biological processes. Shaded boxes represent significant enrichment (light gray P > 0.05, black P < 0.0004). (d) Gene Set Enrichment Analysis comparing the lung ILC gene expression signature with a previously published data set examining the effects of LPS-induced acute lung injury. Analysis of the top transcripts in the LPS-treated group shows presence of amphiregulin (highlighted by arrow).
Figure 7
Figure 7. Amphiregulin is produced by lung ILCs and can restore lung function, barrier integrity and respiratory tissue remodeling following influenza virus-induced damage
(a) mRNA expression of amphiregulin (Areg) in sort-purified CD90+ CD25+ T1/ST2+ lung ILCs compared to CD90+ CD4+ splenic LTi cells. (b) Production of amphiregulin protein by sort-purified lung ILCs stimulated with IL-2, IL-7, +/− IL-33 for four days, as measured by ELISA. mRNA (c) and protein (d) expression of amphiregulin in the lung of naïve or PR8-infected Rag1−/− mice at day 10 p.i. (e) mRNA expression of amphiregulin in the lung of naïve or PR8-infected Rag1−/− mice receiving isotype or anti-CD90.2 mAb (day 10 p.i.). (f-l) Rag1−/− mice were infected i.n. with 0.5 LD50 PR8 and treated with isotype, anti-CD90.2 mAb, or anti-CD90.2 mAb + 5–10 µg recombinant murine amphiregulin i.p. every 2 days. (f) Representative flow cytometry plots of lung ILCs in antibody-treated mice. (g) Body temperature of antibody-treated mice at day 10 p.i. (h) Percentage blood oxygen saturation in antibody-treated mice. (i) Total protein concentration in BAL fluid at day 10 p.i. (j-l) H&E staining of lung tissue in isotype (j), anti-CD90.2 (k) and anti-CD90.2 + AREG (l) treated mice at day 10 p.i. Black arrows indicate epithelial cell hyperplasia and gray arrows denote regions of epithelial shedding/necrosis within the bronchioles. Scale bar = 50 µm. Data is representative of 2 independent experiments n = 3–4 mice per group. Data shown are the mean ± SEM. *P < 0.05, ** P < 0.01, *** P < 0.001.

Comment in

References

    1. Turner JR. Intestinal mucosal barrier function in health and disease. Nat Rev Immunol. 2009;9:799–809. - PubMed
    1. Artis D. Epithelial-cell recognition of commensal bacteria and maintenance of immune homeostasis in the gut. Nat Rev Immunol. 2008;8:411–420. - PubMed
    1. Sonnenberg GF, Fouser LA, Artis D. Functional biology of the IL-22-IL-22R pathway in regulating immunity and inflammation at barrier surfaces. Adv Immunol. 2010;107:1–29. - PubMed
    1. Spits H, Di Santo JP. The expanding family of innate lymphoid cells: regulators and effectors of immunity and tissue remodeling. Nat Immunol. 2011;12:21–27. - PubMed
    1. Saenz SA, Noti M, Artis D. Innate immune cell populations function as initiators and effectors in Th2 cytokine responses. Trends Immunol. 2010;31:407–413. - PubMed

Publication types

MeSH terms