. 2011 Sep 25;17(10):1275-82.
doi: 10.1038/nm.2459.

Tumor suppressor BRCA1 epigenetically controls oncogenic microRNA-155

Affiliations

Tumor suppressor BRCA1 epigenetically controls oncogenic microRNA-155

Suhwan Chang et al. Nat Med. .

Erratum in

  • Nat Med. 2011 Nov;17(11):1521
  • Nat Med. 2011 Oct;17(10):2 p following 1282

Abstract

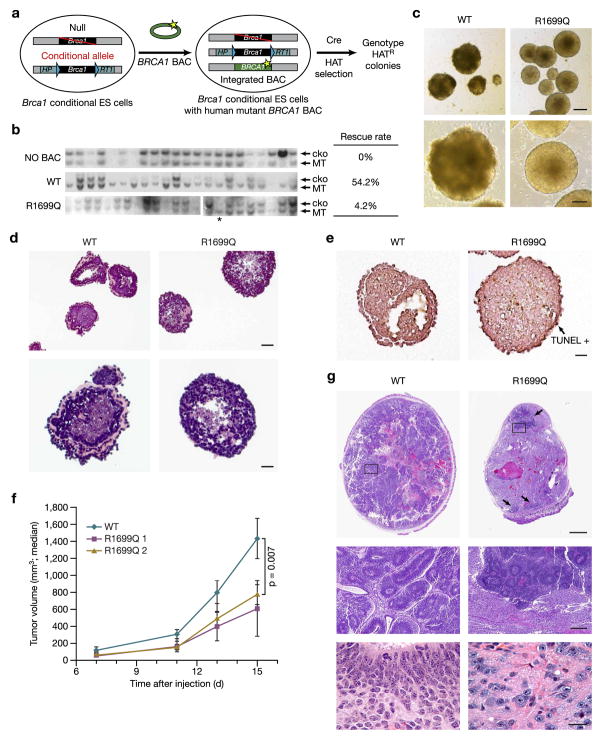
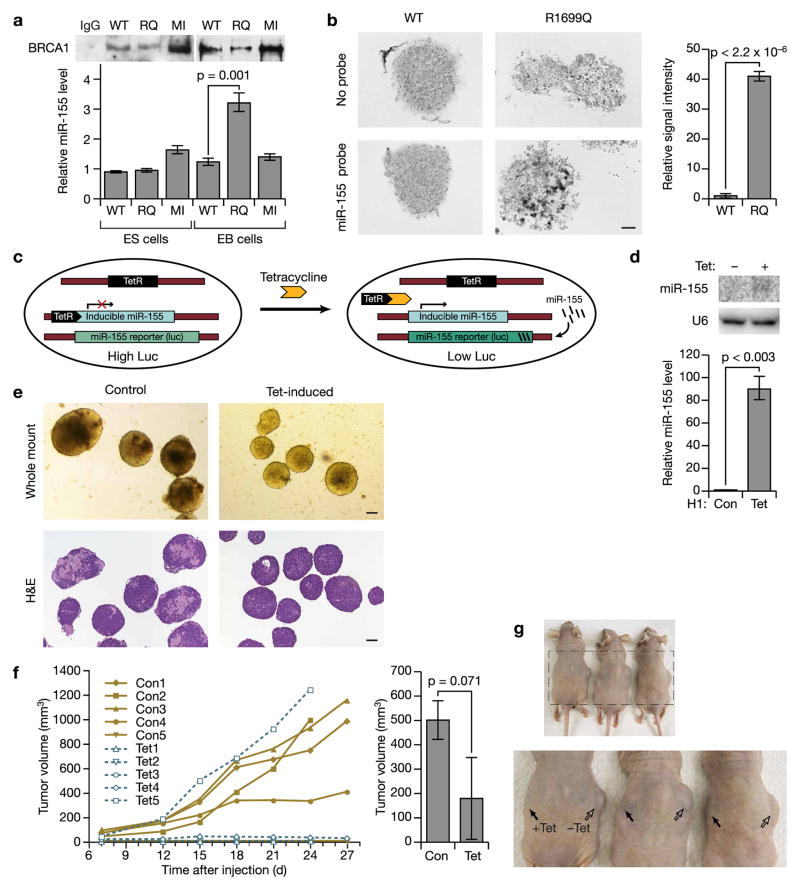
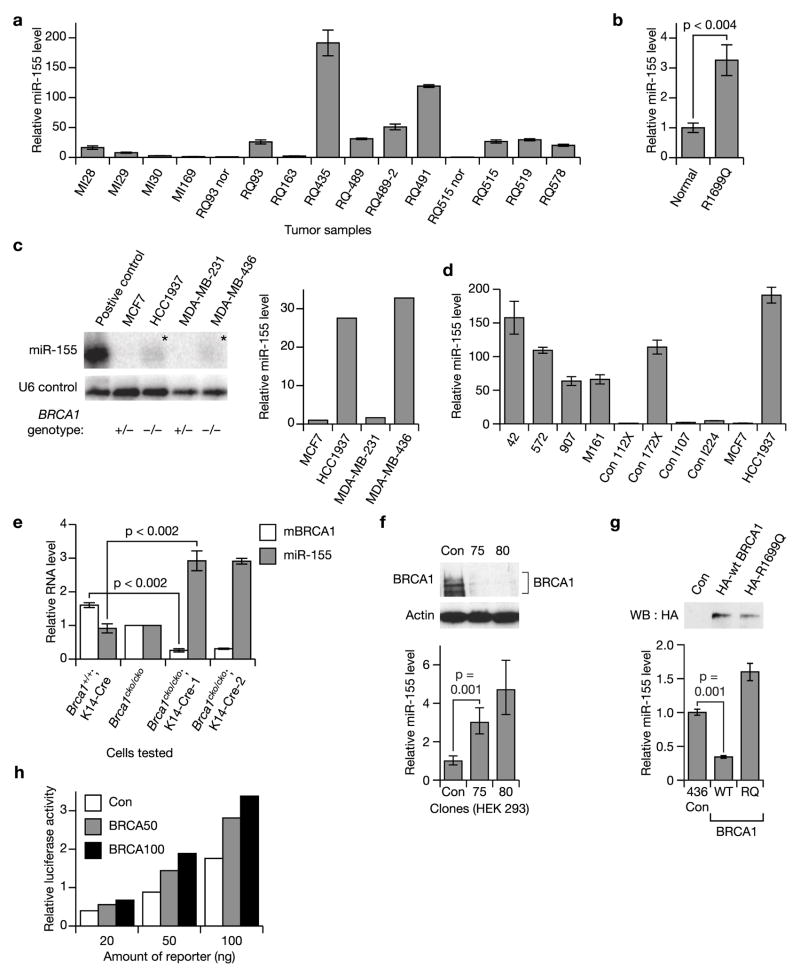
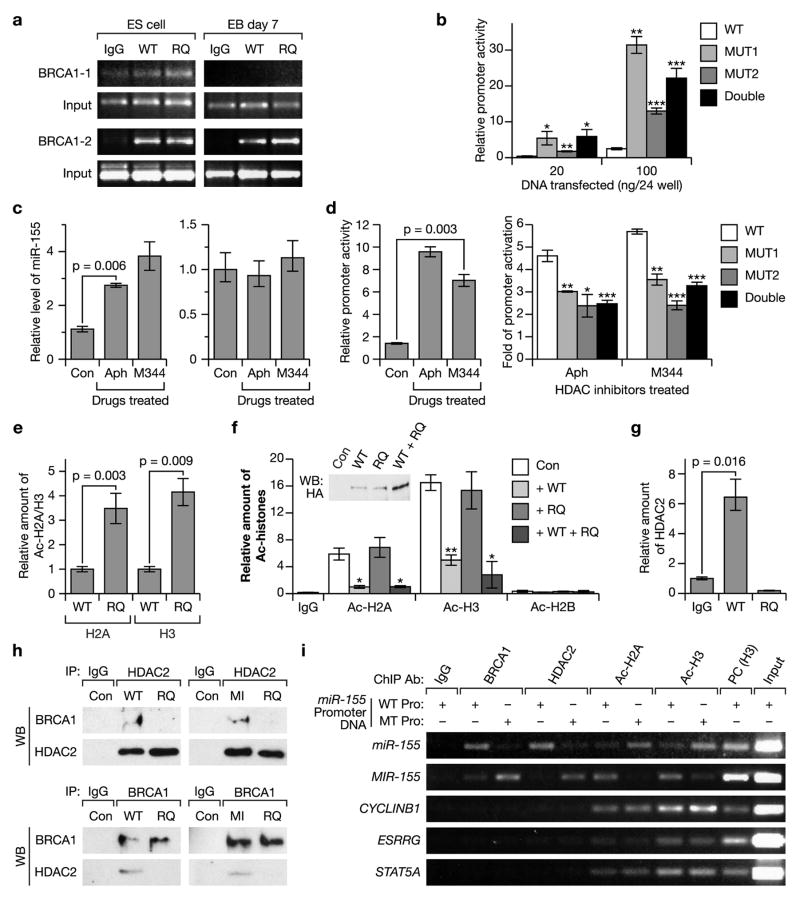
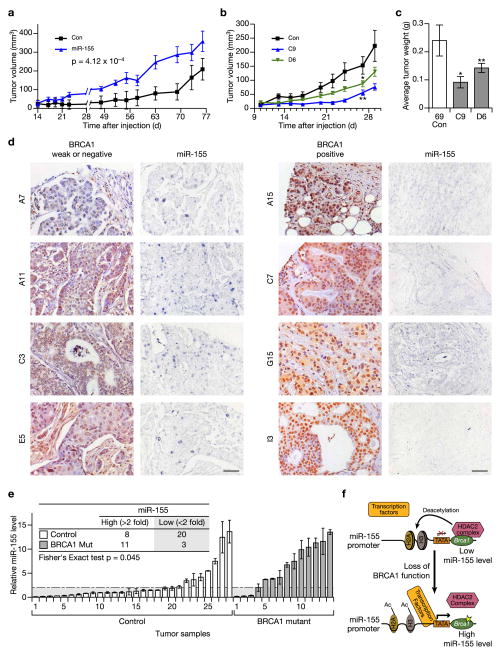
BRCA1, a well-known tumor suppressor with multiple interacting partners, is predicted to have diverse biological functions. However, so far its only well-established role is in the repair of damaged DNA and cell cycle regulation. In this regard, the etiopathological study of low-penetrant variants of BRCA1 provides an opportunity to uncover its other physiologically important functions. Using this rationale, we studied the R1699Q variant of BRCA1, a potentially moderate-risk variant, and found that it does not impair DNA damage repair but abrogates the repression of microRNA-155 (miR-155), a bona fide oncomir. Mechanistically, we found that BRCA1 epigenetically represses miR-155 expression via its association with HDAC2, which deacetylates histones H2A and H3 on the miR-155 promoter. We show that overexpression of miR-155 accelerates but the knockdown of miR-155 attenuates the growth of tumor cell lines in vivo. Our findings demonstrate a new mode of tumor suppression by BRCA1 and suggest that miR-155 is a potential therapeutic target for BRCA1-deficient tumors.


Conflict of interest statement

COMPETING FINANCIAL INTERESTS

The authors declare no competing financial interests.

Figures

Figure 1
Figure 1
R1699Q mutant ES cells show reduced survival and differentiation defects. (a) Schematics of generation of R1699Q ES cells using PL2F8 cells containing a null and a conditional allele of Brca1. Two halves of human HPRT1 minigenes (HP and RT) flanking the two loxP sites (shaded triangles) of the conditional allele. Cre recombinants are HAT resistant (HATR). (b) Southern hybridization of HATR colonies from experiments without BAC (NO BAC), wild-type (WT) BRCA1 BAC and R1699Q BRCA1 BAC. Bottom band, null allele (MT); top band, conditional allele (cko). Rescue rate, percentage Brca1ko/ko clones. Asterisk, Brca1ko/ko ES cell. (c) Whole mount of embryoid bodies generated from ES cells expressing wild-type (left) and R1699Q (right) BRCA1 at day 14 in culture. Bottom, higher magnification of embryoid bodies. Scale bar, 50 μm, top; 20 μm, bottom. (d) H&E staining of embryoid bodies generated from ES cells expressing wild-type (left) and R1699Q (right) BRCA1 at day 14 in culture. Scale bar, 100 μm, top; 50 μm, bottom. (e) TUNEL staining of embryoid bodies. Arrow, TUNEL+ cells. Scale bar, 50 μm. (f) Teratoma growth of one wild-type and two R1699Q clones were examined in mice (n = 5 for each group). Values are means ± s.e.m. (P = 0.007). (g) H&E staining of teratomas dissected 15 d after injection. Top, section of the whole teratoma; middle, magnified images of the regions indicated at top. Arrows, neurorosette structures. Bottom, neural cells immature in wild-type (left) and more differentiated in R1699Q (right) teratomas. Scale bar, 2 μm, top; 0.2 μm, middle; 50 μm, bottom.
Figure 2
Figure 2
Identification of miR-155 upregulation in R1699Q mutant cells and its effect on ES cell differentiation. (a) Quantification of miR-155 by rtPCR in wild-type (WT), R1699Q (RQ) and M1652I (MI) ES cells and embryoid bodies (EB cells) on day 7 of culture. U6 small nuclear RNA (snRNA) was used for normalization. Top, BRCA1 protein expression. (b) Representative pictures of miR-155 in situ hybridization in wild-type and R1699Q embryoid bodies using DIG-labeled antisense LNA of miR-155. Top, no-probe controls showing background signal (scale bar, 50 μm). Right, relative average signal. Error bar = s.d. (c) Schematic of miR-155 inducible system in ES cells. miR-155 is induced by tetracycline, which then represses the luciferase reporter (luc) containing miR-155-binding sites at the 3′ end. (d) miR-155 overexpression in ES cells after tetracycline (tet) induction, with U6 snRNA as control. Top, overexpression by northern hybridization; bottom, quantification by rtPCR. Error bar = s.d. (e) Representative pictures of embryoid bodies generated from wild-type ES cells with induced expression of miR-155. Top, whole mount of embryoid bodies; bottom, H&E-stained sections. Scale bar, 100 μm. (f) Teratoma growth of wild-type ES cells with (Tet1–Tet5) and without (Con1–Con5) miR-155 induction. Left, teratoma growth. Right, average tumor volume on day 18 after injection. Minimum value of each group was excluded (n = 4; values are means ± s.e.m.). (g) Representative picture of teratomas in mice injected with control cells (−Tet, right) and Tet-induced cells (+Tet, left). Bottom, enlarged view.
Figure 3
Figure 3
BRCA1 negatively controls miR-155 expression. (a) Quantification of miR-155 in tumors from the Brca1ko/+;Trp53ko/+;TgR1699Q mice (RQ, n = 9). Normal liver (RQ93 nor), mammary gland (RQ515 nor) and tumors from Brca1ko/+;Trp53ko/+;TgM1652I mice (MI, n = 4) used as control. (b) Quantification of miR-155 in a breast tumor from an R1699Q mutation carrier. Normal, normal breast tissue. (c) Expression analysis of miR-155 by northern hybridization in four human breast cancer cell lines of different BRCA1 genotypes. Positive control, HEK293 cell line overexpressing miR-155; loading control, U6 snRNA; asterisk, miR-155 signal. Right, quantification of signal, normalized by U6 snRNA. (d) rtPCR of miR-155 in four Brca1 deficient tumors (42, 572, 907 and M161) from Brca1cko/cko;p53ko/+;MMTV Cre mice and four tumors (Con 112X, Con 172X, Con I107 and Con I224) from Her2/Neu transgenic mice. MCF7 and HCC1937 were negative and positive control, respectively. (e) rtPCR of miR-155 in MECs from two Brca1cko/cko;K14 Cre mice. Control, MECs from K14 Cre only and Brcacko/cko. (f) Knockdown of BRCA1 in two clones (75 and 80) of HEK293 cells stably expressing BRCA1 short hairpin RNA (top). Loading control, β-actin (middle). Bottom, rtPCR quantification of miR-155 in the BRCA1 knockdown clones (75 and 80). Con, control. (g) Real-time quantification of miR-155 after ectopic expression of wild-type (WT) or R1699Q BRCA1 in BRCA1-deficient MDA-MB-436 cells. Top, expression of wild-type and R1699Q BRCA1. (h) miR-155 reporter assay in BRCA1-deficient HCC1937 cells using increasing amounts of wild-type BRCA1 cDNA (Con, untransfected cells and BRCA50, 50 ng; BRCA100, 100 ng. Error bar = s.d.
Figure 4
Figure 4
Mechanism of miR-155 repression by BRCA1. (a) Binding of BRCA1 to miR-155 promoter at two potential regions (BRCA1-1 and BRCA1-2). ES cells and embryoid bodies (EB) at day 7 in culture with wild-type and R1699Q (RQ). BRCA1 by ChIP assay. Input, 5% of total chromatin. (b) Effect of mutation of putative BRCA1-binding sites (Mut1, Mut2 or double mutant) on miR-155 promoter activation measured by luciferase assay (*P < 0.05, **P < 0.01, ***P < 0.005). (c) Effect of HDAC inhibitors on miR-155 expression measured by rtPCR in BRCA1+ MDA-MB-468 (left) and BRCA1-deficient MDA-MB-436 cells (right). Con, no treatment; Aph, apicidin. (d) Effect of HDAC inhibitors on wild-type miR-155 promoter (left) and mutant promoter (right) activation in MDA-MB-468 cells measured by luciferase assay (*P < 0.02, **P < 0.01, ***P < 0.005). Con, no treatment; Aph, apicidin. (e) ChIP assay to quantify acetylation level of histones H2A and H3 on miR-155 promoter, in wild-type and R1699Q EB cells by rtPCR. (f) Effect of wild-type, RQ and wild-type + RQ BRCA1 on acetylation of histones H2A and H3 on miR-155 promoter in MDA-MB-436 cells measured by ChIP assay and rtPCR. Con, transfection with vector only (*P < 0.02, **P < 0.01). Western blot (WB) analysis of ectopic protein expression using antibody to hemagglutinin (HA). (g) Association of HDAC2 on miR-155 promoter in wild-type and R1699Q EB cells analyzed by ChIP assay and rtPCR. IgG, negative control. (h) Co-immunoprecipitation (Co-IP) between HDAC2 and wild-type or M1652I or R1699Q BRCA1 in MECs from mice with wild-type or R1699Q BAC transgenes (left) or M1652I transgene (right). Top panels, IP with HDAC2 antibody; bottom panels IP with human-specific BRCA1 antibody. (i) MDA-MB 468 cells transfected with luciferase reporter plasmid with mouse wild-type or double mutant (MT) miR-155 promoter (pro). ChIP assay was carried out with indicated antibodies (Ab). Association of BRCA1-HDAC2 complex and acetylation of histones H2A and H3 on transfected mouse miR-155 promoter (mir155, top) and endogenous miR-155 promoter (MIR155 to test competition effect. BRCA1 binding on ESRRG, CCNB1 and STAT5A promoters with putative binding sites. Error bar = s.d.
Figure 5
Figure 5
Physiological relevance of miR-155 upregulation in BRCA1-deficient tumors. (a) Xenograft tumor growth of MDA-MB-468 cells with stable expression of miR-155 (P = 4.12 × 10⁻⁴, ANCOVA test). Values are mean ± s.e.m. (b) Growth of two clones (C9 and D6) with miR-155 stable knockdown and the parental cells (Con) orthotropically transplantated in mice (values are means ± s.e.m., *P = 0.031, **P = 0.025). (c) Average mass of tumors in b (values are means ± s.e.m.). (d) Representative pictures of 66 human breast tumors in tumor tissue microarray probed with antibody to BRCA1 (Ab-1) or mouse IgG (negative control) and DIG-labeled antibody to miR-155. Scale bar, 50 μm. (e) rtPCR quantification of miR-155 in 28 tumors from non-BRCA1 controls and 14 tumors from BRCA1 mutation (mut) carriers (see Supplementary Table 6 for mutation description). RNU5A was used for normalization. Shaded area, low miR-155 based on two-fold cut-off (dashed horizontal line). Text box, number of miR-155 high and low tumors in each group. (f) Schematic of role for BRCA1 in epigenetic control of miR-155 promoter. In wild-type BRCA1–containing cells, miR-155 is silenced by the BRCA1-HDAC2 complex, which deacetylates H2A and H3 histones. Without functional BRCA1, the interaction of BRCA1-HDAC2 complex is disrupted, which in turn increases acetylated (Ac) H2A and H3, which activates the miR-155 promoter.

Comment in

References

    1. O’Donovan PJ, Livingston DM. BRCA1 and BRCA2: breast/ovarian cancer susceptibility gene products and participants in DNA double-strand break repair. Carcinogenesis. 2010;31:961–967. - PubMed
    1. Venkitaraman AR. Linking the cellular functions of BRCA genes to cancer pathogenesis and treatment. Annu Rev Pathol. 2009;4:461–487. - PubMed
    1. Deng CX. BRCA1: cell cycle checkpoint, genetic instability, DNA damage response and cancer evolution. Nucleic Acids Res. 2006;34:1416–1426. - PMC - PubMed
    1. Xia Y, Pao GM, Chen HW, Verma IM, Hunter T. Enhancement of BRCA1 E3 ubiquitin ligase activity through direct interaction with the BARD1 protein. J Biol Chem. 2003;278:5255–5263. - PubMed
    1. Baer R, Ludwig T. The BRCA1/BARD1 heterodimer, a tumor suppressor complex with ubiquitin E3 ligase activity. Curr Opin Genet Dev. 2002;12:86–91. - PubMed

Publication types

MeSH terms