. 2011 Dec 1;589(Pt 23):5741-58.
doi: 10.1113/jphysiol.2011.213520. Epub 2011 Sep 26.

Visual motion integration by neurons in the middle temporal area of a New World monkey, the marmoset

Affiliations

Visual motion integration by neurons in the middle temporal area of a New World monkey, the marmoset

Selina S Solomon et al. J Physiol. .

Abstract

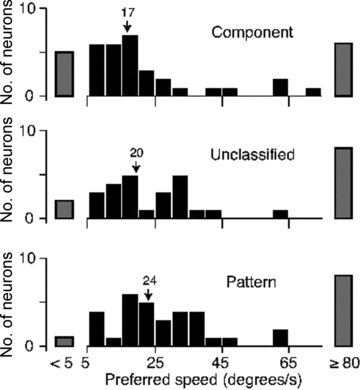
The middle temporal area (MT/V5) is an anatomically distinct region of primate visual cortex that is specialized for the processing of image motion. It is generally thought that some neurons in area MT are capable of signalling the motion of complex patterns, but this has only been established in the macaque monkey. We made extracellular recordings from single units in area MT of anaesthetized marmosets, a New World monkey. We show through quantitative analyses that some neurons (35 of 185; 19%) are capable of signalling pattern motion ('pattern cells'). Across several dimensions, the visual response of pattern cells in marmosets is indistinguishable from that of pattern cells in macaques. Other neurons respond to the motion of oriented contours in a pattern ('component cells') or show intermediate properties. In addition, we encountered a subset of neurons (22 of 185; 12%) insensitive to sinusoidal gratings but very responsive to plaids and other two-dimensional patterns and otherwise indistinguishable from pattern cells. We compared the response of each cell class to drifting gratings and dot fields. In pattern cells, directional selectivity was similar for gratings and dot fields; in component cells, directional selectivity was weaker for dot fields than gratings. Pattern cells were more likely to have stronger suppressive surrounds, prefer lower spatial frequencies and prefer higher speeds than component cells. We conclude that pattern motion sensitivity is a feature of some neurons in area MT of both New and Old World monkeys, suggesting that this functional property is an important stage in motion analysis and is likely to be conserved in humans.


Figures

Figure 1
Figure 1. Response of a neuron in middle temporal (MT) area of a marmoset to rapid serial presentation of drifting gratings and plaids
A, rapid serial presentation of visual stimuli. The stimulus remained on the screen, drifting, for 320 ms, after which a new stimulus was chosen randomly. The set of stimuli included a blank screen and gratings and plaids drifting in each of 12 directions.B, raster plot showing the time of occurrence of action potentials, aligned to the onset of a grating drifting in the preferred direction. Each line shows one of the 43 trials of this stimulus.C, peristimulus time histogram (PSTH) of response generated from the raster plot shown inB, but over an expanded time scale. Bin width 10 ms. Example error bar shows 1 SEM.D, same asC, but for response aligned to the onset of the most effective plaid.E, procedure for estimating the optimal time window over which to analyse response. Peristimulus time histograms like those inCandDwere made for all stimuli in the set. The same latency was used for all PSTHs. From each PSTH, we obtained the average rate over a 320 ms time window following the test latency; from these estimates of average rate, we determined the variance in rate across stimuli. The position of the sliding window that maximized response variance across stimuli (here a window starting 90 ms after stimulus transition) was used for subsequent analyses. The dashed lines inCandDshow the beginning and end of this time window.
Figure 2
Figure 2. Motion integration of four neurons from area MT of a marmoset
Each panel shows mean rate over a 320 ms period, for drifting gratings (contrast 0.5; filled circles) and plaids formed by linear superposition of two gratings with directions 120 deg apart (open circles). In each case, responses have been aligned such that the preferred direction for a grating is 0 deg; the direction of the plaid is the average of its two components, aligned to the preferred direction for a grating. The dotted curve shows the predicted response of an ideal component cell to the plaid (see Methods); the predicted response of an ideal pattern cell is that it will respond in the same way to the grating and the plaid. The classification of neurons inACis based on the metrics shown in Fig. 3A.A, component cell. Same cell as Fig. 1.B, unclassified cell.C, pattern cell.D, one of the neurons in our sample with robust and unimodal responses to plaids but weak response to gratings. The grating response is insufficient to classify the motion selectivity of the neuron. Stimulus parameters for the neuron inAare as follows: spatial frequency 0.8 cycles deg−1; temporal frequency 11.1 Hz; size 11.0 deg. For the neuron inB, these parameters were 0.25 cycles deg−1, 16.7 Hz and 16.9 deg; for the neuron inC, 0.2 cycles deg−1, 10.0 Hz and 20.0 deg; and for the neuron inD, 0.4 cycles deg−1, 10.0 Hz and 7.0 deg. Error bars inA–Dshow 1 SEM.
Figure 3
Figure 3. Quantification of motion integration across a population of neurons in area MT of a marmoset
For each neuron, we compared response to plaids with that predicted for ideal component and pattern cells by computing the partial correlation with each prediction.A, a scatter plot of the partial correlation between measured response and that of an ideal component cell (zc) or ideal pattern cell (zp). The dashed lines separate regions of pattern (open symbols), unclassified (grey symbols) and component cells (filled symbols; see Methods). Open symbols not in the pattern region of the plot mark neurons, such as that in Fig. 2D, that have very weak responses to gratings and in which the pattern cell prediction is therefore compromised. Triangles mark the neurons shown in Fig. 2. Neurons in whichzc is less than −1.28 are plotted on the abscissa.B, the distribution of the difference inzc andzp. Open bars show pattern cells, grey bars show unclassified cells and filled bars the component cells. Neurons with responses like those in Fig. 2D are not included in the distribution.
Figure 4
Figure 4. Temporal evolution of plaid response in pattern cells and component cells
A, mean trajectory ofzc andzp for pattern cells (n = 50; open circles), unclassified cells (n = 84; grey circles) and component cells (n = 90; filled symbols). For each neuron, we calculatedzc andzp for the cumulative response, in bins of 10 ms, so the bins marked ‘100’ show the averagezc andzp values obtained for responses up to 100 ms following onset of the stimulus. Neurons were classified on the basis of response over the entire 320 ms analysis window. The numbers along each line show the time of the relevant datum in milliseconds, relative to onset of the stimulus. The dashed lines separate regions of pattern, unclassified and component cells.B, evolution of pattern selectivity in pattern cells (zpzc) and component selectivity in component cells (zczp). The dashed horizontal line replots the relevant significance boundary fromA. In this plot, partial correlations were calculated from the cumulative response, as was done inA.C, same asB, but with partial correlations calculated for each 10 ms time bin independently. Error bars inBandCshow 95% confidence intervals for the mean obtained by bootstrapping.
Figure 5
Figure 5. Temporal evolution of response gain and directional selectivity in pattern cells and component cells
For each neuron, we measured responses to 12 directions of a drifting grating of contrast 0.5.A, average direction tuning curves for pattern and component cells for response obtained in a single 10 ms bin, either 100 ms after stimulus transition (upper panels) or 300 ms after (lower panels). In each case, stimulus direction was aligned to that preferred in the time bin under study. Response was normalized to that for the preferred direction, averaged over the entire 320 ms analysis window.B, average PSTH in response to a grating moving in the preferred direction, for pattern cells (open circles) and component cells (filled circles). For each neuron, spontaneous activity was subtracted and response normalized to the average over the entire 320 ms analysis window. Bin width 10 ms.C, circular variance as a function of time. Measurements were made independently in each 10 ms bin. Conventions are as inB. Error bars inA–Cshow 95% confidence intervals on the mean obtained by bootstrapping.
Figure 6
Figure 6. Response of four neurons to drifting gratings and dot fields
Same neurons as Fig. 2. Each panel shows the mean rate of one neuron during 320 ms presentation of a drifting grating (filled circles) at the preferred temporal frequency, and a dot field (open circles) drifting at the preferred speed. The grating responses are replotted from Fig. 2. Dot size was 0.4 deg, and all dots drifted in the same direction with infinite lifetime. For the neuron inA, the dot field was of size 16.9 deg, and dots drifted at a speed of 10.0 deg s−1. For the neuron inB, these parameters were 16.9 deg and 40.0 deg s−1; for the neuron inC, 11.0 deg and 30.0 deg s−1; and for the neuron inD, 7.0 deg and 10.0 deg s−1. Error bars inA–Dshow 1 SEM.
Figure 7
Figure 7. Directional selectivity of neurons in area MT derived from measures of circular variance (CV)
Each panel shows the distribution of CV (see Methods) for mean rate. Values of one indicate neurons with equal response to all directions; values of zero indicate neurons with response to only one direction. Tuning curves were made from responses to equally spaced 12 directions, as shown in Fig. 6. Arrows show the distribution mean.A, CV of response to drifting gratings of preferred temporal frequency. Mean CV of component cells is 0.25 (median 0.18, SD 0.19, n = 36); of unclassified cells 0.31 (median 0.27, SD 0.22, n = 32); and of pattern cells 0.27 (median 0.21, SD 0.18, n = 32).B, CV of response to drifting dot fields of preferred speed. Same populations of neurons as inA. Mean CV of component cells is 0.30 (median 0.26, SD 0.17); of unclassified cells is 0.30 (median 0.23, SD 0.17); and of pattern cells is 0.20 (median 0.17, SD 0.11).
Figure 8
Figure 8. Directional selectivity of neurons in area MT derived from measures of bandwidth
The best prediction of a circular Gaussian was found for the mean rate of each neuron (see Methods). Each panel shows the distribution of the standard deviation of this Gaussian. Conventions as in Fig. 7.A, bandwidth of response to drifting gratings of preferred temporal frequency. Mean bandwidth of component cells is 22.0 deg (median 18.8, SD 13.5, n = 36); of unclassified cells is 26.4 deg (median 27.8, SD 13.8, n = 28); and of pattern cells is 34.1 deg (median 34.7, SD 11.6, n = 25).B, bandwidth of response to drifting dot fields of preferred speed. Same population of neurons as inA. Mean bandwidth of component cells is 44.2 deg (median 45.6, SD 17.1); of unclassified cells is 42.0 deg (median 39.5, SD 15.36); and of pattern cells is 34.9 deg (median 35.7, SD 8.9).
Figure 9
Figure 9. Tuning properties of neurons in area MT obtained using drifting gratings
AC, mean rate of two example neurons in response to drifting gratings, as a function of the spatial frequency (A), temporal frequency (B) or size (C) of that grating. One neuron is a pattern cell (grey open symbols and dashed lines); the other is a component cell (filled symbols and continuous lines). The lines show the best-fitting predictions of descriptive functions fitted to the data in each panel.D, distribution of characteristic spatial frequency for component cells (top panel), unclassified cells (middle panel) and pattern cells (bottom panel). This parameter indicates the spatial frequency resolution of each neuron. Arrows show the means of the distributions. Mean frequency is 1.3 cycles deg−1 (median 1.11, SD 0.85, n = 55) for component cells, 0.91 cycles deg−1 (median 0.68, SD 0.80, n = 46) for unclassified cells and 0.82 cycles deg−1 (median 0.66, SD 0.6, n = 48) for pattern cells.E, distribution of preferred temporal frequency. Conventions as inD. Mean frequency is 10.2 Hz (median 9.4, SD 4.8, n = 47) for component cells, 10.8 Hz (median 10.6, SD 5.3, n = 40) for unclassified cells and 11.62 Hz (median 10.2, SD 6.2, n = 43) for pattern cells.F, distribution of preferred grating size. Conventions as inDandE. Mean size was 14.8 deg (median 15.1, SD 8.2, n = 27) for component cells, 11.8 deg (median 10.2, SD 6.3, n = 30) for unclassified cells and 14.1 deg (median 12.5, SD 8.4, n = 24) for pattern cells.
Figure 10
Figure 10. Distributions of preferred speed for neurons in area MT obtained using drifting dot fields
Distribution of preferred speed for component cells (top panel), unclassified cells (middle panel) and pattern cells (bottom panel). Arrows show the mean of the distributions for neurons with preferred speed between 5 and 80 deg s−1. Mean speed is 17.4 deg s−1 (median 12.8, SD 18.1, n = 41) for component cells, 19.8 deg s−1 (median 16.6, SD 13.8, n = 34) for unclassified cells and 24.2 deg s−1 (median 22.2, SD 14.4, n = 40) for pattern cells.
Figure 11
Figure 11. Distributions of contrast sensitivity of neurons in area MT obtained using drifting gratings
AandB, distributions for component cells (top panel), unclassified cells (middle panel) and pattern cells (bottom panel).A, distributions of the semi-saturation constant of the Naka–Rushton function, c50. Arrows show the mean for neurons with ac50 below 0.5. Meanc50 is 0.16 (median 0.15, SD 0.10, n = 36) for component cells, 0.11 (median 0.10, SD 0.08, n = 32) for unclassified cells and 0.15 (median 0.11, SD 0.11, n = 34) for pattern cells.B, distributions of the slope atc50. Conventions as inA. Mean slope is 265 impulses s−1 (unit contrast)−1 (median 119, SD 396, n = 36) for component cells, 330 impulses s−1 (unit contrast)−1 (median 175, SD 358, n = 32) for unclassified cells and 275 impulses s−1 (unit contrast)−1 (median 113, SD 365, n = 34) for pattern cells.

Similar articles

Cited by

References

    1. Adelson EH, Bergen JR. Spatiotemporal energy models for the perception of motion. J Opt Soc Am A. 1985;2:284–299. - PubMed
    1. Albright TD. Direction and orientation selectivity of neurons in visual area MT of the macaque. J Neurophysiol. 1984;52:1106–1130. - PubMed
    1. Allman J, Miezin F, McGuinness E. Direction- and velocity-specific responses from beyond the classical receptive field in the middle temporal visual area (MT) Perception. 1985;14:105–126. - PubMed
    1. Allman JM, Kaas JH. A representation of the visual field in the caudal third of the middle tempral gyrus of the owl monkey (Aotus trivirgatus) Brain Res. 1971;31:85–105. - PubMed
    1. Baker JF, Petersen SE, Newsome WT, Allman JM. Visual response properties of neurons in four extrastriate visual areas of the owl monkey (Aotus trivirgatus): a quantitative comparison of medial, dorsomedial, dorsolateral, and middle temporal areas. J Neurophysiol. 1981;45:397–416. - PubMed

Publication types

LinkOut - more resources