. 2011 Nov;21(11):1788-99.
doi: 10.1101/gr.116442.110. Epub 2011 Sep 23.

Post-transcriptional exon shuffling events in humans can be evolutionarily conserved and abundant

Affiliations

Post-transcriptional exon shuffling events in humans can be evolutionarily conserved and abundant

Haya H Al-Balool et al. Genome Res. 2011 Nov.

Abstract

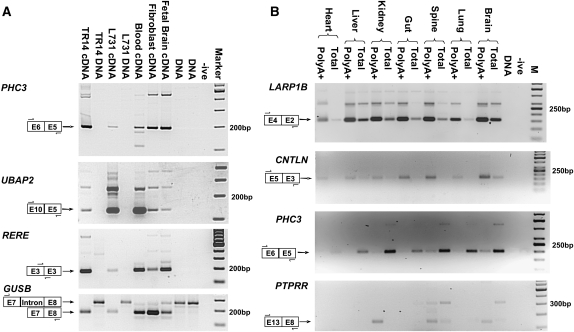
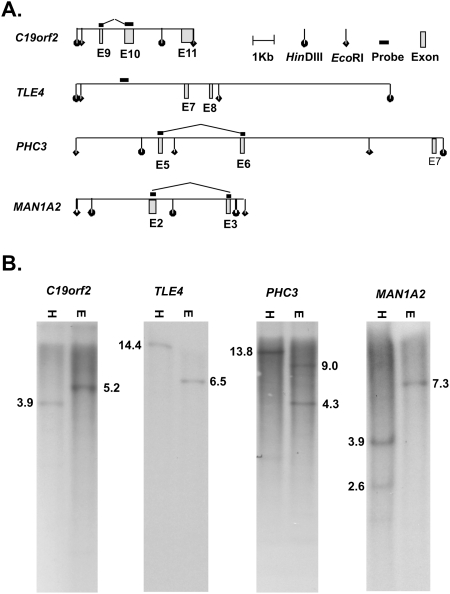
In silico analyses have established that transcripts from some genes can be processed into RNAs with rearranged exon order relative to genomic structure (post-transcriptional exon shuffling, or PTES). Although known to contribute to transcriptome diversity in some species, to date the structure, distribution, abundance, and functional significance of human PTES transcripts remains largely unknown. Here, using high-throughput transcriptome sequencing, we identify 205 putative human PTES products from 176 genes. We validate 72 out of 112 products analyzed using RT-PCR, and identify additional PTES products structurally related to 61% of validated targets. Sequencing of these additional products reveals GT-AG dinucleotides at >95% of the splice junctions, confirming that they are processed by the spliceosome. We show that most PTES transcripts are expressed in a wide variety of human tissues, that they can be polyadenylated, and that some are conserved in mouse. We also show that they can extend into 5' and 3' UTRs, consistent with formation via trans-splicing of independent pre-mRNA molecules. Finally, we use real-time PCR to compare the abundance of PTES exon junctions relative to canonical exon junctions within the transcripts from seven genes. PTES exon junctions are present at <0.01% to >90% of the levels of canonical junctions, with transcripts from MAN1A2, PHC3, TLE4, and CDK13 exhibiting the highest levels. This is the first systematic experimental analysis of PTES in human, and it suggests both that the phenomenon is much more widespread than previously thought and that some PTES transcripts could be functional.


Figures

Figure 1.
Figure 1.
Expression of human PTES transcripts. PTES structures, approximate primer location, and expected amplicon size are indicated for each panel. (A) Validation of human PTES transcripts. Amplification of products from the PHC3, UBAP2, and RERE genes are shown. TR14 is a neuroblastoma cell line (Rupniak et al. 1984), and L731 is one of the templates used for HTG sequencing (see Methods). GUSB is a control for template quality (see text). (-ive) No template negative control; (Marker) 100-bp ladder. (B) Polyadenylation and tissue specificity of transcripts. Amplification products from the LARP1B, CNTLN, PHC3, and PTPRR genes are shown. All templates are cDNAs generated from total or PolyA+ RNAs extracted from human fetal tissues (see Methods). (-ive) No template negative control; (M) 50-bp ladder (panels 13) and 100-bp ladder (panel 4).
Figure 2.
Figure 2.
Additional PTES products identified from RT-PCR amplicons. Amplification products from the C19orf2 E10-E3 and HDGFRP3 E5-E2 RT-PCR validation are shown. Structures, genomic splice junctions, and associated cDNA sequence traces are shown. Splice junctions are indicated using dotted lines in both DNA and cDNA sequences. Terminal gt-ag dinucleotides of inferred introns within genomic sequence are shown in red. Sequence internal to RefSeq exons is shown in upper case. (E) Exonic; (I) intronic; and (3′) novel exonic sequence derived from 3′ of the annotated C19orf2 gene.
Figure 3.
Figure 3.
Identification of extended PTES products using junction-specific primers. Amplicons generated using primers specific for C19orf2 PTES E10-E2 splice junction are shown. Primers 1 and 2 amplify from the 5′ UTR to the E10-E2 breakpoint. Primers 3 and 4 amplify from the E10-E2 breakpoint to the 3′ UTR. Templates are as follows: (NB3) cDNA where the E10-E2 PTES product was originally identified; (+ive) unrearranged (canonical) C19orf2 cDNA clone (AK292170); and (-ive) no template. The exon organization of the inferred E10-E2 spliced PTES RNAs, the full-length C19orf2 gene from RefSeq (canonical), and the AK292170 +ive control is also shown, together with the position of primers used and the expected amplicon sizes. Individual exons are shown as boxes, with coding regions shown in gray and UTRs in white. The sizes of the PTES amplicons are given relative to the E10-E2 junction. Additional products of ∼0.4–0.65 kb and ∼1.2 kb are seen when the NB3 template is amplified using primers 1 and 2, suggesting that shorter C19orf2 PTES isoforms also exist. For all primers, see Supplemental Table S6.
Figure 4.
Figure 4.
RT-PCR amplification of murine PTES products corresponding to known human structures. The amplicon corresponding to the expected PTES structure is highlighted in each case. The additional amplicons seen in panels 1 and 3 are the expected size for murine orthologs of additional human products (MAN1A2 E6-E2, Supplemental Table S6; TLE4 E8-E5, GenBank accession no. HQ283388). For Tle4, a Gapdh loading control was included. For details of primers and amplicons, see Supplemental Table S6.
Figure 5.
Figure 5.
Identification of abundant PTES products using real-time PCR. (A) TLE4; (B) PHC3; (C) CDK13; and (D) MAN1A2. Each panel shows PTES and canonical transcript abundance in four human tissues estimated using both standard curves (upper bars) and the Δ − Ct method (lower bars) As all genes are expressed at a lower level than control genes, −Δ − Ct values are plotted to facilitate comparison with data from standard curves. (Thal) Thalamus; (Cereb) cerebellum. Additional data are presented in Supplemental Figures S4 and S5. For all primers, see Supplemental Table S6.
Figure 6.
Figure 6.
Genomic Southern analysis of PTES exons. (A) Position of exons flanking PTES junctions in four genes relative to genomic HinDIII and EcoR1 sites (Build GRCh37/19). (B) Southern blots of human genomic DNA using the probe and enzyme combinations shown in A ([H] HinDIII; [E] EcoR1). The expected product sizes are shown in each case. For details, see Methods and Supplemental Table S6.

References

    1. Akopian AN, Okuse K, Souslova V, England S, Ogata N, Wood JN 1999. Trans-splicing of a voltage-gated sodium channel is regulated by nerve growth factor. FEBS Lett 445: 177–182 - PubMed
    1. Berget SM, Moore C, Sharp PA 1977. Spliced segments at the 5′ terminus of adenovirus 2 late mRNA. Proc Natl Acad Sci 74: 3171–3175 - PMC - PubMed
    1. Blumenthal T 1995. Trans-splicing and polycistronic transcription in Ceanorhabditis elegans. Trends Genet 11: 132–136 - PubMed
    1. Case M, Matheson E, Minto L, Hassan R, Harrison CJ, Bown N, Bailey S, Vormoor J, Hall AG, Irving JAE 2008. Mutation of genes impacting on the RAS pathway are common in childhood acute lymphoblastic leukemia. Cancer Res 68: 6803–6809 - PubMed
    1. Caudevilla C, Serra D, Miliar A, Codony C, Asins G, Bach M, Hegardt FG 1998. Natural trans-splicing in carnitine octanoyltransferase pre-mRNAs in rat liver. Proc Natl Acad Sci 95: 12185–12190 - PMC - PubMed

Publication types

LinkOut - more resources