

In vivo photoacoustic and photothermal cytometry for monitoring multiple blood rheology parameters
- PMID: 21948731
- PMCID: PMC3734562
- DOI: 10.1002/cyto.a.21133
In vivo photoacoustic and photothermal cytometry for monitoring multiple blood rheology parameters
Abstract
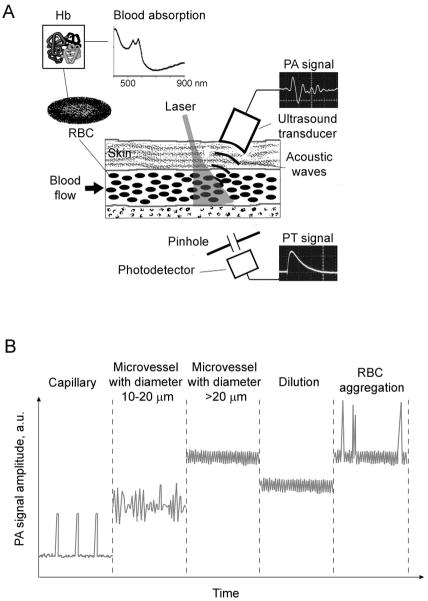
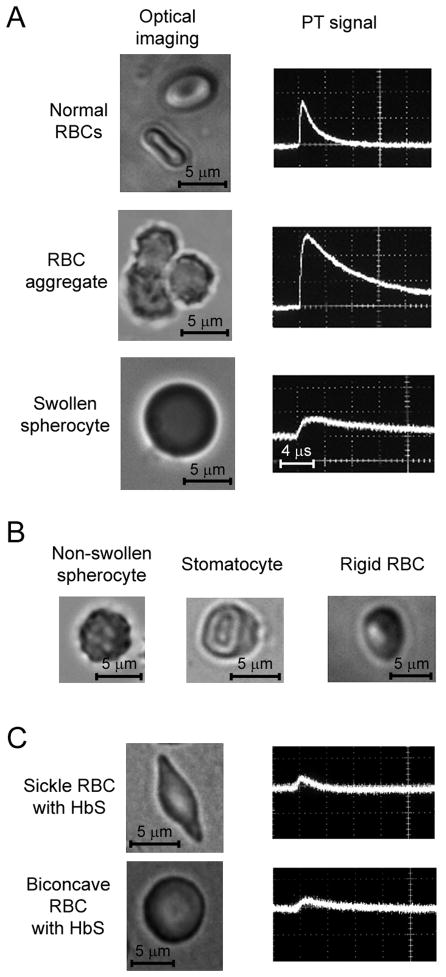
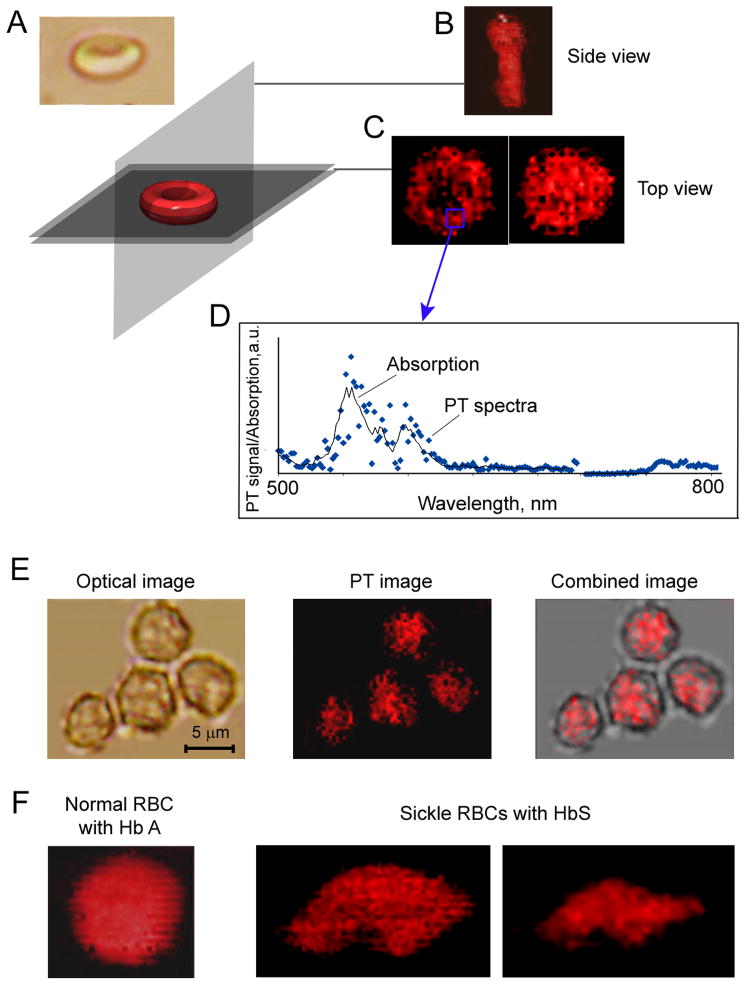
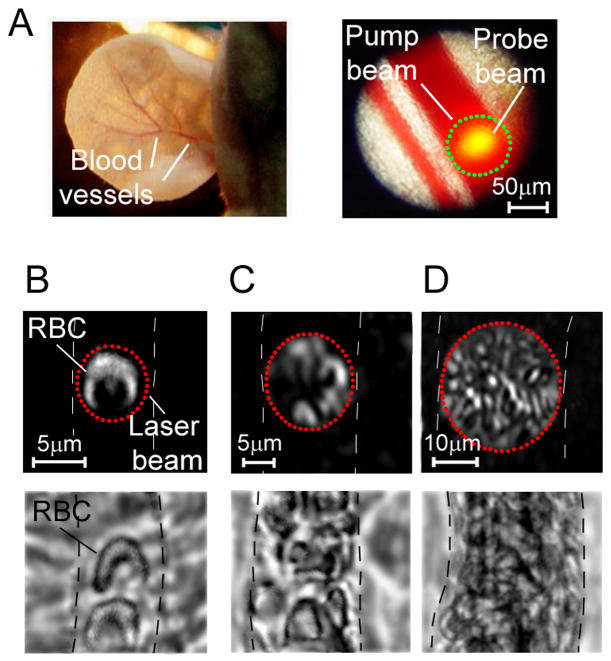
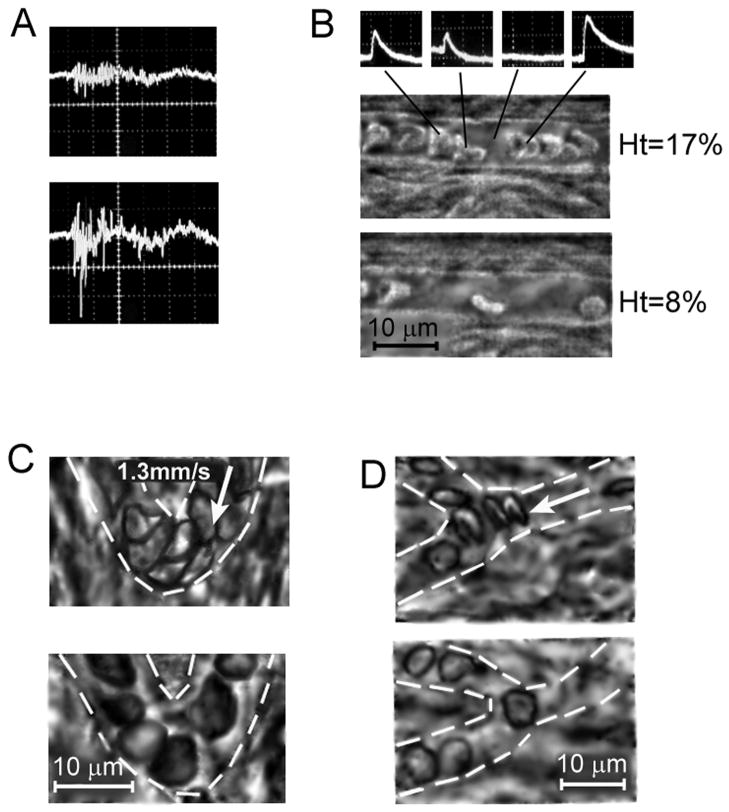
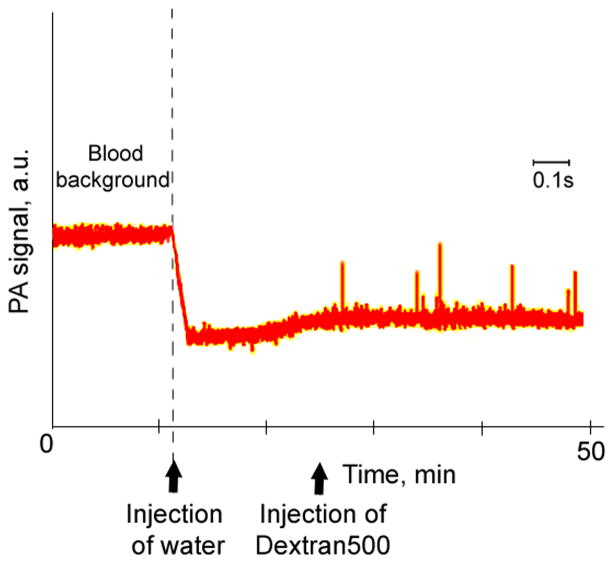
Alterations of blood rheology (hemorheology) are important for the early diagnosis, prognosis, and prevention of many diseases, including myocardial infarction, stroke, sickle cell anemia, thromboembolism, trauma, inflammation, and malignancy. However, real-time in vivo assessment of multiple hemorheological parameters over long periods of time has not been reported. Here, we review the capabilities of label-free photoacoustic (PA) and photothermal (PT) flow cytometry for dynamic monitoring of hemorhelogical parameters in vivo which we refer to as photoacoustic and photothermal blood rheology. Using phenomenological models, we analyze correlations between both PT and PA signal characteristics in the dynamic modes and following determinants of blood rheology: red blood cell (RBC) aggregation, deformability, shape (e.g., as in sickle cells), intracellular hemoglobin distribution, individual cell velocity, hematocrit, and likely shear rate. We present ex vivo and in vivo experimental verifications involving high-speed PT imaging of RBCs, identification of sickle cells in a mouse model of human sickle cell disease and in vivo monitoring of complex hemorheological changes (e.g., RBC deformability, hematocrit and RBC aggregation). The multi-parameter platform that integrates PT, PA, and conventional optical techniques has potential for translation to clinical applications using safe, portable, laser-based medical devices for point-of-care screening of disease progression and therapy efficiency.
Copyright © 2011 International Society for Advancement of Cytometry.
Figures
References
-
- Lowe GD. Blood rheology in vitro and in vivo. Baillieres Clin Haematol. 1987;1:597–636. - PubMed
-
- Lipowsky HH. Microvascular rheology and hemodynamics. Microcirculation. 2005;12:5–15. - PubMed
-
- Dintenfass L. Blood rheology in cardio-vascular diseases. Nature. 1963;199:813–815. - PubMed
-
- Schmid-Schönbein H. Blood rheology and physiology of microcirculation. Ric Clin Lab. 1981;11 (Suppl 1):13–33. - PubMed
-
- Reggiori G, Occhipinti G, De Gasperi A, Vincent JL, Piagnerelli M. Early alterations of red blood cell rheology in critically ill patients. Crit Care Med. 2009;37:3041–3046. - PubMed
Publication types
MeSH terms
Substances
Grants and funding
LinkOut - more resources
Full Text Sources
Other Literature Sources
Medical
