. 2011 Nov;77(22):7984-97.
doi: 10.1128/AEM.05374-11. Epub 2011 Sep 23.

Metabolome remodeling during the acidogenic-solventogenic transition in Clostridium acetobutylicum

Affiliations

Metabolome remodeling during the acidogenic-solventogenic transition in Clostridium acetobutylicum

Daniel Amador-Noguez et al. Appl Environ Microbiol. 2011 Nov.

Abstract

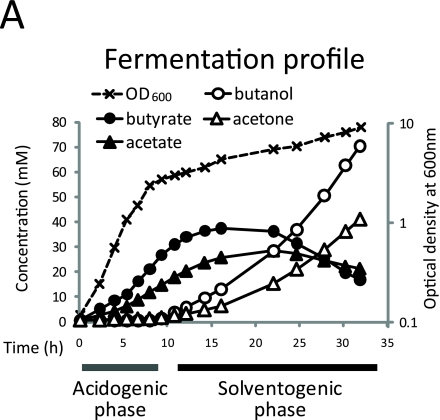
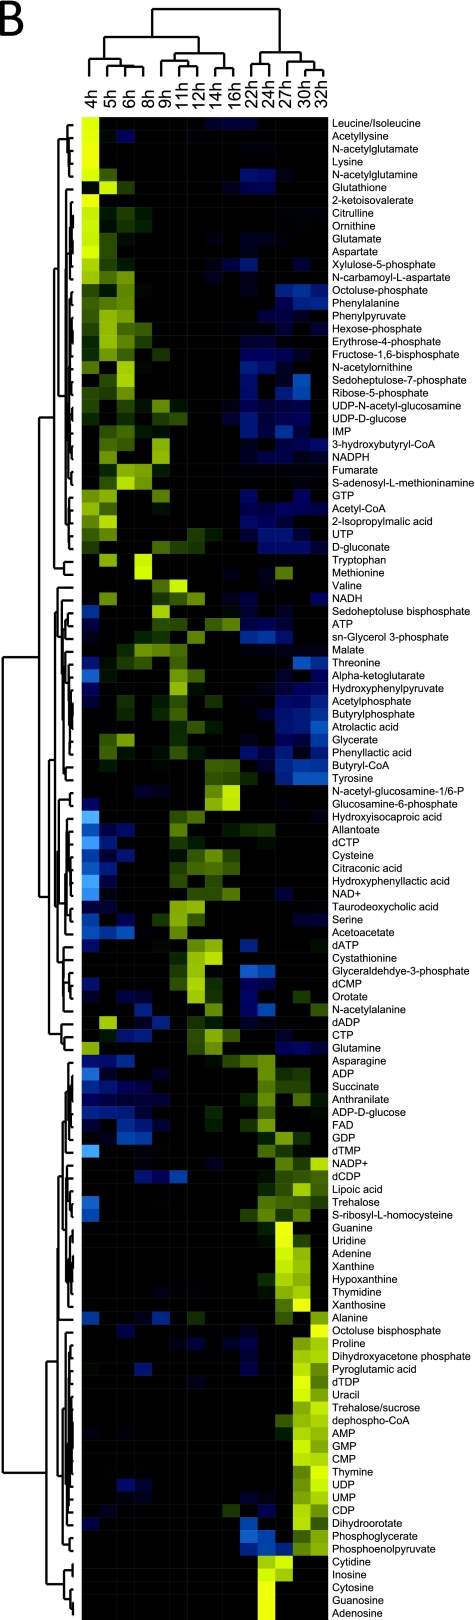
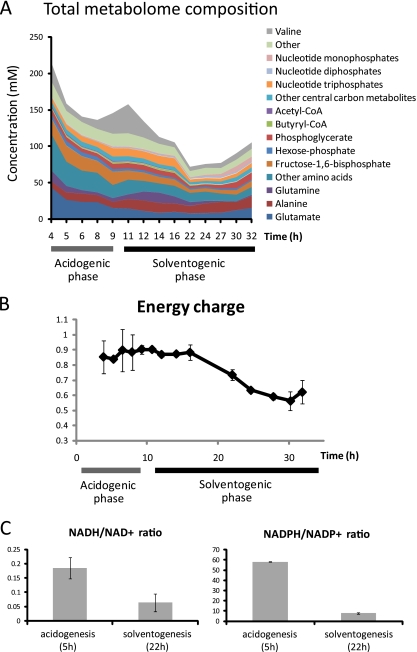
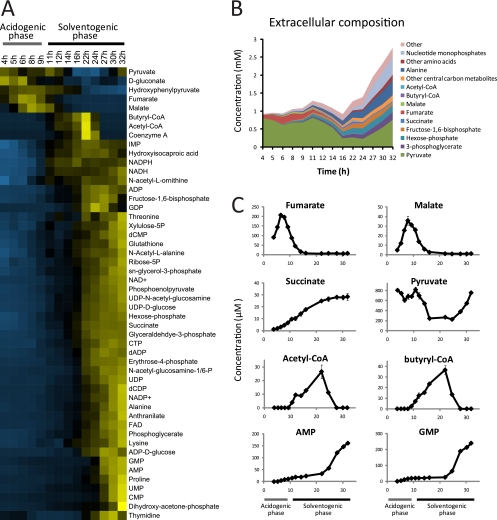
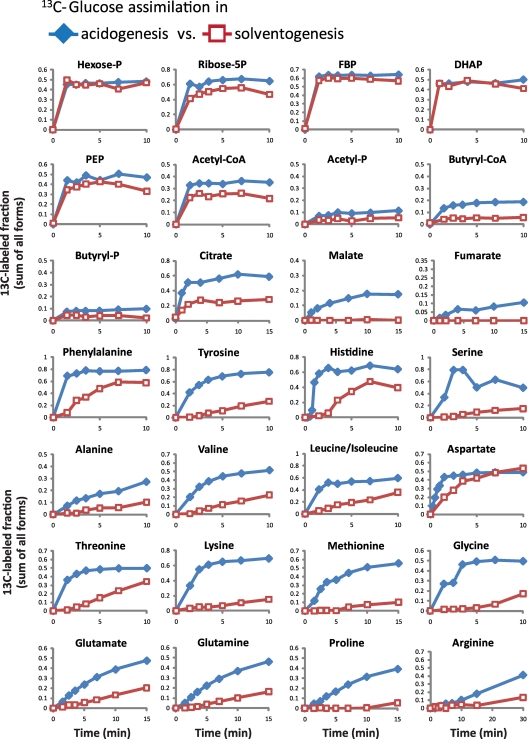
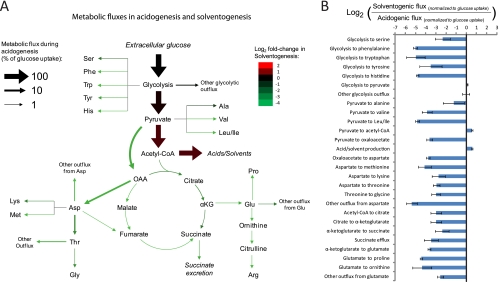
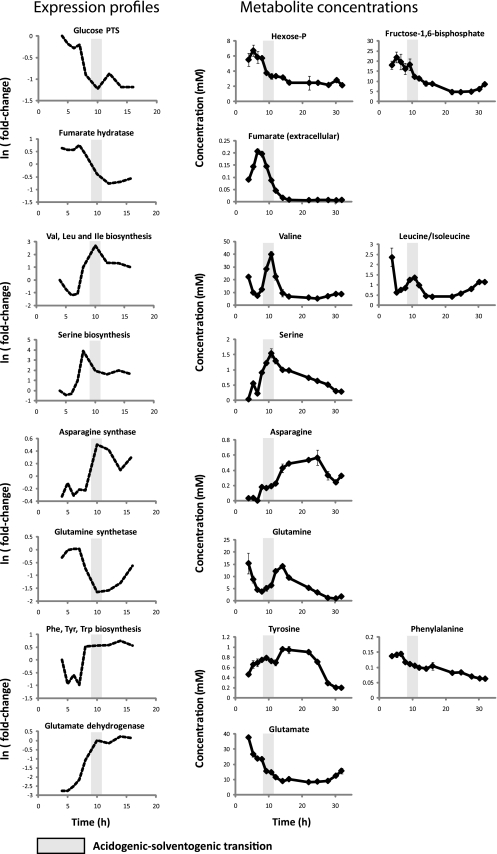
The fermentation carried out by the biofuel producer Clostridium acetobutylicum is characterized by two distinct phases. Acidogenesis occurs during exponential growth and involves the rapid production of acids (acetate and butyrate). Solventogenesis initiates as cell growth slows down and involves the production of solvents (butanol, acetone, and ethanol). Using metabolomics, isotope tracers, and quantitative flux modeling, we have mapped the metabolic changes associated with the acidogenic-solventogenic transition. We observed a remarkably ordered series of metabolite concentration changes, involving almost all of the 114 measured metabolites, as the fermentation progresses from acidogenesis to solventogenesis. The intracellular levels of highly abundant amino acids and upper glycolytic intermediates decrease sharply during this transition. NAD(P)H and nucleotide triphosphates levels also decrease during solventogenesis, while low-energy nucleotides accumulate. These changes in metabolite concentrations are accompanied by large changes in intracellular metabolic fluxes. During solventogenesis, carbon flux into amino acids, as well as flux from pyruvate (the last metabolite in glycolysis) into oxaloacetate, decreases by more than 10-fold. This redirects carbon into acetyl coenzyme A, which cascades into solventogenesis. In addition, the electron-consuming reductive tricarboxylic acid (TCA) cycle is shutdown, while the electron-producing oxidative (clockwise) right side of the TCA cycle remains active. Thus, the solventogenic transition involves global remodeling of metabolism to redirect resources (carbon and reducing power) from biomass production into solvent production.


Figures

Fig. 1.
Fig. 1.
Progressive metabolome remodeling during the acidogenic-solventogenic transition. (A) Fermentation profile and growth curve obtained in a pH 4.7 controlled batch culture. (B) Metabolome dynamics during the acidogenic-solventogenic transition. Unsupervised hierarchical cluttering analysis of 114 intracellular metabolite levels was perfromed. Rows represent specific intracellular metabolites. Columns correspond to the fermentation time points shown in panel A, starting at 4 h. Relative metabolite concentrations across time points are normalized to have a mean equal to 0 and a standard deviation equal to 1. Metabolites whose levels are higher than the mean across time points are shown in shades of yellow and those with lower levels than the mean in shades of blue. The individual profiles for each metabolite can be found in Fig. S1 in the supplemental material. The data represent the averages of two replicate measurements from a single batch culture and are representative of the results obtained in three independent experiments (see Fig. S2 in the supplemental material). Hexose-phosphate represents the combined pools of glucose-6-phosphate and fructose-6-phosphate. Phosphoglycerate represents the combined pools of glycerate-2-phosphate and glycerate-3-phosphate.
Fig. 1.
Fig. 1.
Progressive metabolome remodeling during the acidogenic-solventogenic transition. (A) Fermentation profile and growth curve obtained in a pH 4.7 controlled batch culture. (B) Metabolome dynamics during the acidogenic-solventogenic transition. Unsupervised hierarchical cluttering analysis of 114 intracellular metabolite levels was perfromed. Rows represent specific intracellular metabolites. Columns correspond to the fermentation time points shown in panel A, starting at 4 h. Relative metabolite concentrations across time points are normalized to have a mean equal to 0 and a standard deviation equal to 1. Metabolites whose levels are higher than the mean across time points are shown in shades of yellow and those with lower levels than the mean in shades of blue. The individual profiles for each metabolite can be found in Fig. S1 in the supplemental material. The data represent the averages of two replicate measurements from a single batch culture and are representative of the results obtained in three independent experiments (see Fig. S2 in the supplemental material). Hexose-phosphate represents the combined pools of glucose-6-phosphate and fructose-6-phosphate. Phosphoglycerate represents the combined pools of glycerate-2-phosphate and glycerate-3-phosphate.
Fig. 2.
Fig. 2.
Changes in metabolome composition, energy charge, and NAD(P)H/NAD(P)+ ratios during acidogenic-solventogenic transition. (A) Changes in overall metabolome composition. The graph shows the molar abundance of 79 different metabolites, most of them combined as groups of metabolites, during acidogenic-solventogenic transition. The metabolite data and time points correspond to the fermentation shown in Fig. 1A. The data shown represents the average of two replicate measurements from a single batch culture and are representative of three independent experiments (see Fig. S2 in the supplemental material). Hexose-phosphate represents the combined pools of glucose-6-phosphate and fructose-6-phosphate. Phosphoglycerate represents the combined pools of glycerate-2-phosphate and glycerate-3-phosphate. (B) Energy charge during the acidogenic-solventogenic transition. The energy charge (E) was calculated as follows: E = ([ATP] + 1/2[ADP])/([ATP] + [ADP] + [AMP]). The metabolite data and time points correspond to the fermentation shown in Fig. 1A. The error bars show ± the standard errors. (C) NADH/NAD+ and NADPH/NADP+ ratios during acidogenesis and solventogenesis. The data represent the averages of two replicate measurements from two independent experiments. The error bars show ± the standard errors.
Fig. 3.
Fig. 3.
Extracellular metabolites during the solventogenic transition. (A) Unsupervised hierarchical cluttering analysis of extracellular metabolite concentration data. Rows represent specific metabolites. Columns correspond to the fermentation time points shown in Fig. 1A, starting at 4 h. Metabolite concentrations across time points are normalized to have a mean equal to 0 and a standard deviation equal to 1. Concentrations that are higher than the mean across time points are shown in shades of yellow and those lower than the mean in shades of blue. The concentration data for each metabolite can be found in Table S2 in the supplemental material. The data represent the average of two replicate measurements from a single batch culture and are representative of the results obtained in three independent experiments (see Fig. S3 in the supplemental material). Hexose-phosphate represents the combined pools of glucose-6-phosphate and fructose-6-phosphate. (B) Extracellular metabolome composition. The graph shows the molar abundance of 50 different metabolites, most of them combined as groups of metabolites, during the acidogenic-solventogenic transition. (C) Extracellular concentration profiles of selected metabolites. The concentration data for each metabolite can be found in Table S2 in the supplemental material. The error bars show ± the standard errors.
Fig. 4.
Fig. 4.
Isotopic tracer experiments reveals differences in pathway activity in acidogenic versus solventogenic cultures. The rate of incorporation of 13C-labeled glucose into downstream metabolites reveals differences in pathway activity in acidogenic versus solventogenic cultures. At time = 0, universally 13C-labeled glucose was added into mid-exponential-phase or mid-solventogenic-phase cultures in a matching amount to the nonlabeled glucose remaining in the media to reach a 1:1 ratio between 13C-labeled and nonlabeled glucose. Samples were taken at short time intervals after [13C]glucose addition, and the incorporation of 13C-labeled glucose into downstream metabolites was monitored using LC-MS. The line graphs represent the 13C-labeled fraction (sum of all different labeled forms) of the indicated metabolite as a function of time. The data shown are one data set representative of two independent acidogenic and two independent solventogenic cultures. The complete data set is included in Table S3 in the supplemental material.
Fig. 5.
Fig. 5.
Alterations in metabolic fluxes during solventogenesis. We used kinetic flux profiling (KFP) to obtain a quantitative estimate of metabolic fluxes from the kinetics of incorporation of 13C-labeled glucose into downstream metabolites during acidogenesis and solventogenesis. We constructed an ordinary differential equation (ODE) model for the metabolic network shown in Fig. S10 in the supplemental material. One-thousand sets of fluxes (unknown model parameters) that can reproduce the experimental labeling dynamics were identified using a genetic algorithm. (A) Averages of the median flux values (normalized to glucose uptake) obtained from two independent acidogenic cultures. (B) Fold change in median flux values during solventogenesis. The fold change is calculated as the log2(fluxS/fluxA), where fluxS is the solventogenic flux normalized to the glucose uptake and fluxA is the acidogenic flux normalized to the glucose uptake. Data from two independent acidogenic and two independent solventogenic cultures were used in these calculations (see Table S3 in the supplemental material). The mean flux values obtained from each of these experiments are shown in Table S5 in the supplemental material. The one-thousand individual set of fluxes for all cultures are included in Table S6 in the supplemental material, and their distributions are shown in Fig. S11 in the supplemental material. During solventogenesis, the incorporation of 13C-labeled glucose into malate and fumarate is negligible (Fig. 4); therefore, the fold changes for these fluxes are omitted from this figure. The error bars show ± the standard errors.
Fig. 6.
Fig. 6.
Correlation between metabolomic data and previous transcriptomic studies. Selected average expression profiles for various enzymes and metabolic pathways are shown on the left. The concentration profiles of related metabolites are shown on the right. The genes used in each average expression profile included the following: glucose phosphotransferase system (PTS), cac0570, cac2995, and cac3427; fumarate hydratase, cac3091; valine (Val), leucine (Leu), and isoleucine (Ile) biosynthesis, cac3173, cac3172, cac3169, cac3176, cac0091, cac3170, cac1479, cac0273, cac3174, and cac3171; serine biosynthesis, cac0014, cac0015, and cac0263; asparagine synthase, cac2243; glutamine synthetase, cac2658; phenylalanine, tyrosine, and tryptophan biosynthesis, cac3162, cac3163, cac3161, cac3159, cac3162, cac3163; and glutamate dehydrogenase, cac0737. The gray bars indicate the time of the acidogenic-solventogenic transition. Gene expression data were obtained from an earlier study (1).

References

    1. Alsaker K. V., Papoutsakis E. T. 2005. Transcriptional program of early sporulation and stationary-phase events in Clostridium acetobutylicum. J. Bacteriol. 187:7103–7118 - PMC - PubMed
    1. Amador-Noguez D., et al. Systems-level metabolic flux profiling elucidates a complete, bifurcated tricarboxylic acid cycle in Clostridium acetobutylicum. J. Bacteriol. 192:4452–4461 - PMC - PubMed
    1. Baer S. H., Blaschek H. P., Smith T. L. 1987. Effect of butanol challenge and temperature on lipid composition and membrane fluidity of butanol-tolerant Clostridium acetobutylicum. Appl. Environ. Microbiol. 53:2854–2861 - PMC - PubMed
    1. Baer S. H., Bryant D. L., Blaschek H. P. 1989. Electron spin resonance analysis of the effect of butanol on the membrane fluidity of intact cells of Clostridium acetobutylicum. Appl. Environ. Microbiol. 55:2729–2731 - PMC - PubMed
    1. Bajad S. U., et al. 2006. Separation and quantitation of water soluble cellular metabolites by hydrophilic interaction chromatography-tandem mass spectrometry. J. Chromatogr. A 1125:76–88 - PubMed

Publication types

LinkOut - more resources