

Phosphodiesterase 4 inhibition attenuates persistent heart and lung injury by neonatal hyperoxia in rats
- PMID: 21949154
- PMCID: PMC3349366
- DOI: 10.1152/ajplung.00041.2011
Phosphodiesterase 4 inhibition attenuates persistent heart and lung injury by neonatal hyperoxia in rats
Abstract
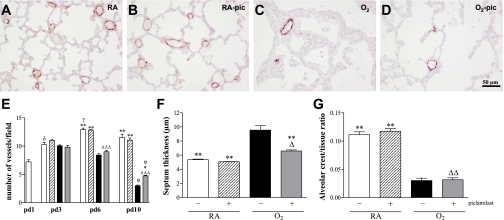
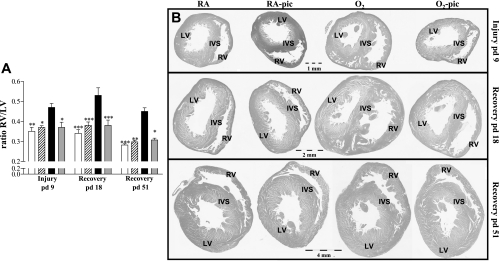
Phosphodiesterase (PDE) 4 inhibitors are potent anti-inflammatory drugs with antihypertensive properties, and their therapeutic role in bronchopulmonary dysplasia (BPD) is still controversial. We studied the role of PDE4 inhibition with piclamilast on normal lung development and its therapeutic value on pulmonary hypertension (PH) and right ventricular hypertrophy (RVH) in neonatal rats with hyperoxia-induced lung injury, a valuable model for premature infants with severe BPD. The cardiopulmonary effects of piclamilast treatment (5 mg·kg(-1)·day(-1)) were investigated in two models of experimental BPD: 1) daily treatment during continuous exposure to hyperoxia for 10 days; and 2) late treatment and injury-recovery in which pups were exposed to hyperoxia or room air for 9 days, followed by 9 or 42 days of recovery in room air combined with treatment started on day 6 of oxygen exposure until day 18. Prophylactic piclamilast treatment reduced pulmonary fibrin deposition, septum thickness, arteriolar wall thickness, arteriolar vascular smooth muscle cell proliferation and RVH, and prolonged survival. In the late treatment and injury-recovery model, hyperoxia caused persistent aberrant alveolar and vascular development, PH, and RVH. Treatment with piclamilast in both models reduced arteriolar wall thickness, attenuated RVH, and improved right ventricular function in the injury recovery model, but did not restore alveolarization or angiogenesis. Treatment with piclamilast did not show adverse cardiopulmonary effects in room air controls in both models. In conclusion, PDE4 inhibition attenuated and partially reversed PH and RVH, but did not advance alveolar development in neonatal rats with hyperoxic lung injury or affect normal lung and heart development.
Figures


Similar articles
-
Angiotensin II type 2 receptor ligand PD123319 attenuates hyperoxia-induced lung and heart injury at a low dose in newborn rats.Am J Physiol Lung Cell Mol Physiol. 2014 Aug 1;307(3):L261-72. doi: 10.1152/ajplung.00345.2013. Epub 2014 Jun 20. Am J Physiol Lung Cell Mol Physiol. 2014. PMID: 24951776 Free PMC article.
-
Sildenafil attenuates pulmonary inflammation and fibrin deposition, mortality and right ventricular hypertrophy in neonatal hyperoxic lung injury.Respir Res. 2009 Apr 29;10(1):30. doi: 10.1186/1465-9921-10-30. Respir Res. 2009. PMID: 19402887 Free PMC article.
-
Apelin attenuates hyperoxic lung and heart injury in neonatal rats.Am J Respir Crit Care Med. 2010 Nov 15;182(10):1239-50. doi: 10.1164/rccm.200909-1361OC. Epub 2010 Jul 9. Am J Respir Crit Care Med. 2010. PMID: 20622042 Free PMC article.
-
The Role of Sphingolipid Signaling in Oxidative Lung Injury and Pathogenesis of Bronchopulmonary Dysplasia.Int J Mol Sci. 2022 Jan 23;23(3):1254. doi: 10.3390/ijms23031254. Int J Mol Sci. 2022. PMID: 35163176 Free PMC article. Review.
-
Animal models of bronchopulmonary dysplasia. The term mouse models.Am J Physiol Lung Cell Mol Physiol. 2014 Dec 15;307(12):L936-47. doi: 10.1152/ajplung.00159.2014. Epub 2014 Oct 10. Am J Physiol Lung Cell Mol Physiol. 2014. PMID: 25305249 Free PMC article. Review.
Cited by
-
Serotonin 2A receptor inhibition protects against the development of pulmonary hypertension and pulmonary vascular remodeling in neonatal mice.Am J Physiol Lung Cell Mol Physiol. 2018 May 1;314(5):L871-L881. doi: 10.1152/ajplung.00215.2017. Epub 2018 Jan 18. Am J Physiol Lung Cell Mol Physiol. 2018. PMID: 29345193 Free PMC article.
-
Acute Lung Functional and Airway Remodeling Effects of an Inhaled Highly Selective Phosphodiesterase 4 Inhibitor in Ventilated Preterm Lambs Exposed to Chorioamnionitis.Pharmaceuticals (Basel). 2022 Dec 26;16(1):29. doi: 10.3390/ph16010029. Pharmaceuticals (Basel). 2022. PMID: 36678525 Free PMC article.
-
Agonists of MAS oncogene and angiotensin II type 2 receptors attenuate cardiopulmonary disease in rats with neonatal hyperoxia-induced lung injury.Am J Physiol Lung Cell Mol Physiol. 2013 Sep;305(5):L341-51. doi: 10.1152/ajplung.00360.2012. Epub 2013 Jun 28. Am J Physiol Lung Cell Mol Physiol. 2013. PMID: 23812633 Free PMC article.
-
Therapies that enhance pulmonary vascular NO-signaling in the neonate.Nitric Oxide. 2020 Feb 1;95:45-54. doi: 10.1016/j.niox.2019.12.003. Epub 2019 Dec 20. Nitric Oxide. 2020. PMID: 31870967 Free PMC article. Review.
-
Postnatal inflammation in the pathogenesis of bronchopulmonary dysplasia.Birth Defects Res A Clin Mol Teratol. 2014 Mar;100(3):189-201. doi: 10.1002/bdra.23220. Epub 2014 Feb 27. Birth Defects Res A Clin Mol Teratol. 2014. PMID: 24578018 Free PMC article. Review.
References
-
- Abman SH. Recent advances in the pathogenesis and treatment of persistent pulmonary hypertension of the newborn. Neonatology 91: 283–290, 2007 - PubMed
-
- Abman SH. Impaired vascular endothelial growth factor signaling in the pathogenesis of neonatal pulmonary vascular disease. Adv Exp Med Biol 661: 323–335, 2010 - PubMed
-
- Abman SH. Pulmonary hypertension in children: a historical overview. Pediatr Crit Care Med 11, Suppl 2: S4–S9, 2010 - PubMed
-
- Baraldi E, Filippone M. Chronic lung disease after premature birth. N Engl J Med 357: 1946–1955, 2007 - PubMed
Publication types
MeSH terms
Substances
Grants and funding
LinkOut - more resources
Full Text Sources
Other Literature Sources