. 2011 Nov 18;286(46):39823-8.
doi: 10.1074/jbc.M111.262725. Epub 2011 Sep 26.

Intracellular K+ concentration decrease is not obligatory for apoptosis

Affiliations

Intracellular K+ concentration decrease is not obligatory for apoptosis

Sara I Börjesson et al. J Biol Chem. .

Abstract

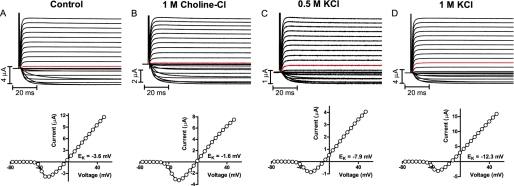
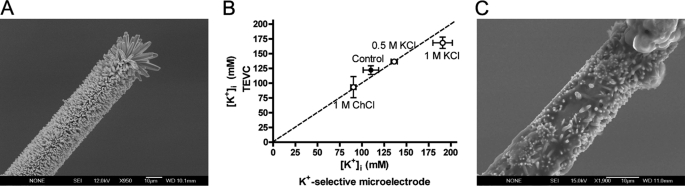
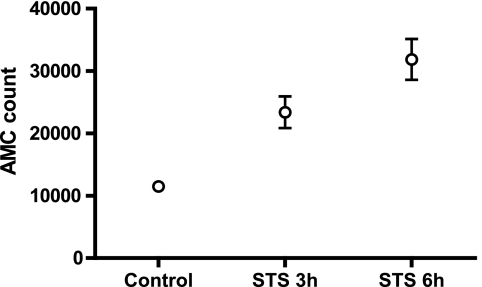
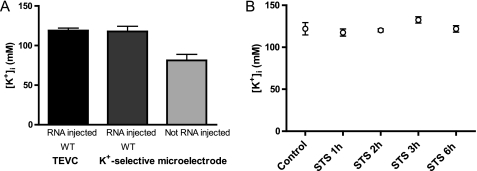
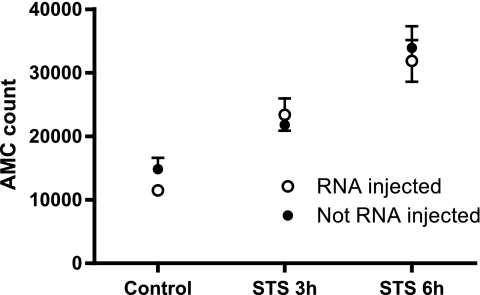
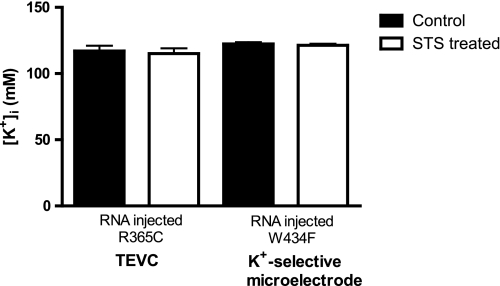
K(+) efflux is observed as an early event in the apoptotic process in various cell types. Loss of intracellular K(+) and subsequent reduction in ionic strength are suggested to release the inhibition of proapoptotic caspases. In this work, a new K(+)-specific microelectrode was used to study possible alterations in intracellular K(+) in Xenopus laevis oocytes during chemically induced apoptosis. The accuracy of the microelectrode to detect changes in intracellular K(+) was verified with parallel electrophysiological measurements. In concordance with previous studies on other cell types, apoptotic stimuli reduced the intracellular K(+) concentration in Xenopus oocytes and increased caspase-3 activity. The reduction in intracellular K(+) was prevented by dense expression of voltage-gated K (Kv) channels. Despite this, the caspase-3 activity was increased similarly in Kv channel-expressing oocytes as in oocytes not expressing Kv channels. Thus, in Xenopus oocytes caspase-3 activity is not dependent on the intracellular concentration of K(+).


Figures

FIGURE 1.
FIGURE 1.
Representative K+ current recordings (upper) and corresponding I(V) curves (lower) measured electrophysiologically in Kv channel-expressing Xenopus oocytes. A, data for control oocytes. B–D, data for oocytes injected with the indicated test solutions. The holding potential was set to −80 mV, and test pulses ranged from −80 to +50 mV. The current generated by stepping to 0 mV is marked in red in each recording.
FIGURE 2.
FIGURE 2.
Electrophysiological recordings and the K+-selective microelectrodes report similar intracellular K+ concentrations. A, scanning electrode image of the K+-selective microelectrode before intracellular measurements. B, intracellular K+ concentrations in Kv channel-expressing Xenopus oocytes measured with two-electrode voltage-clamp (TEVC) and K+-selective microelectrode techniques. Data are expressed as mean values for control oocytes and oocytes injected with 50 nl of indicated test solutions. Error bars show S.E. n = 3–5. C, scanning electron microscope image of the K+-selective microelectrode after intracellular measurements.
FIGURE 3.
FIGURE 3.
Caspase-3 activity in oocytes not expressing Kv channels. Measurements were done in control solution (n = 4) and after 3-h (n = 4) and 6-h (n = 3) exposure to 1 μm STS. The fluorescence after caspase-3 cleavage of Ac-DEVD-AMC was measured with photospectrometry and corrected with total protein level. Data show mean values ± S.E. (error bars).
FIGURE 4.
FIGURE 4.
Intracellular K+ concentrations in apoptotic Xenopus oocytes with and without dense expression of Kv channels. A, intracellular concentration of K+ after 6-h incubation in STS. Mean values for oocytes densely expressing Kv channels (RNA injected) were measured with the two-electrode voltage-clamp method (TEVC; n = 5) or K+-selective microelectrode method (n = 5). Intracellular K+ concentration in oocytes not expressing Kv channels (Not RNA injected) was measured with the K+-selective microelectrode (n = 5). Data are expressed as mean values ± S.E. (error bars). B, intracellular K+ concentrations measured with electrophysiological method. Measurements were made in control solution (n = 5) and after 1 (n = 3), 2 (n = 3), 3 (n = 3), and 6 h (n = 5) of 1 μm STS exposure.
FIGURE 5.
FIGURE 5.
Caspase-3 activity in apoptotic oocytes expressing (RNA injected) or not expressing (Not RNA injected) Kv channels. The fluorescence after caspase-3 cleavage of Ac-DEVD-AMC was measured with photospectrometry and corrected with total protein level. Data show mean values ± S.E. (error bars).
FIGURE 6.
FIGURE 6.
Intracellular K+ concentrations in control and apoptotic Xenopus oocytes with dense expression of mutant Shaker Kv channels. R365C was measured with the two-electrode voltage-clamp method (TEVC) and the nonconducting W434F mutant with the K+-selective microelectrode method. STS-treated cells were incubated for 6 h in 1 μm STS. Data are expressed as mean values ± S.E. (error bars).

References

    1. Hille B. (2001) Ion Channels of Excitable Membranes, 3rd Ed., Sinauer Associates, Sunderland, MA
    1. Bortner C. D., Cidlowski J. A. (2007) Arch. Biochem. Biophys. 462, 176–188 - PMC - PubMed
    1. Thompson G. J., Langlais C., Cain K., Conley E. C., Cohen G. M. (2001) Biochem. J. 357, 137–145 - PMC - PubMed
    1. Bortner C. D., Sifre M. I., Cidlowski J. A. (2008) J. Biol. Chem. 283, 7219–7229 - PMC - PubMed
    1. Hughes F. M., Jr., Bortner C. D., Purdy G. D., Cidlowski J. A. (1997) J. Biol. Chem. 272, 30567–30576 - PubMed

Publication types