. 2011 Oct 25;108(43):E943-51.
doi: 10.1073/pnas.1100132108. Epub 2011 Sep 26.

A whole-genome RNAi screen identifies an 8q22 gene cluster that inhibits death receptor-mediated apoptosis

Affiliations

A whole-genome RNAi screen identifies an 8q22 gene cluster that inhibits death receptor-mediated apoptosis

Nicholas Dompe et al. Proc Natl Acad Sci U S A. .

Abstract

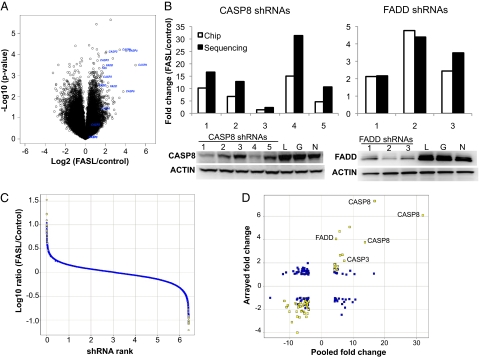
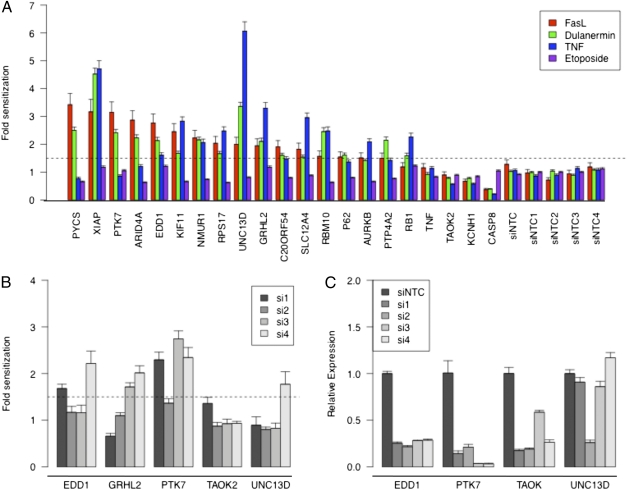
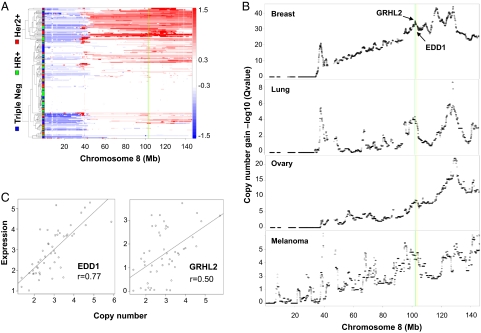
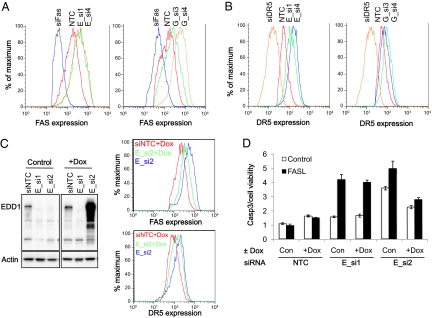
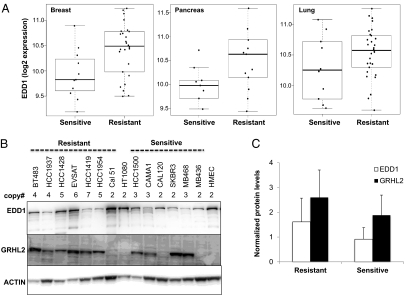
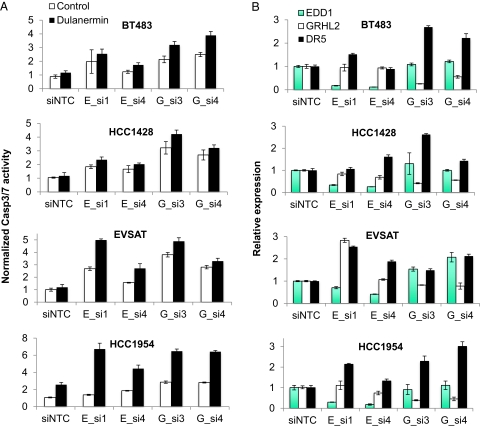
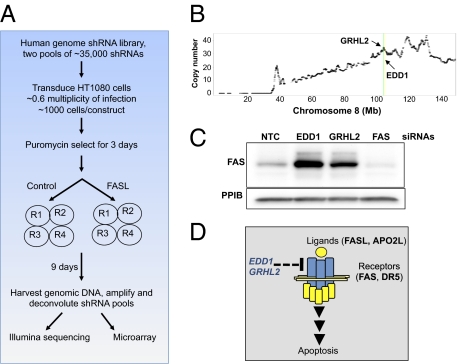
Deregulation of apoptosis is a common occurrence in cancer, for which emerging oncology therapeutic agents designed to engage this pathway are undergoing clinical trials. With the aim of uncovering strategies to activate apoptosis in cancer cells, we used a pooled shRNA screen to interrogate death receptor signaling. This screening approach identified 16 genes that modulate the sensitivity to ligand induced apoptosis, with several genes exhibiting frequent overexpression and/or copy number gain in cancer. Interestingly, two of the top hits, EDD1 and GRHL2, are found 50 kb apart on chromosome 8q22, a region that is frequently amplified in many cancers. By using a series of silencing and overexpression studies, we show that EDD1 and GRHL2 suppress death-receptor expression, and that EDD1 expression is elevated in breast, pancreas, and lung cancer cell lines resistant to death receptor-mediated apoptosis. Supporting the relevance of EDD1 and GRHL2 as therapeutic candidates to engage apoptosis in cancer cells, silencing the expression of either gene sensitizes 8q22-amplified breast cancer cell lines to death receptor induced apoptosis. Our findings highlight a mechanism by which cancer cells may evade apoptosis, and therefore provide insight in the search for new targets and functional biomarkers for this pathway.


Conflict of interest statement

Conflict of interest statement: All the authors are employees of Genentech.

Figures

Fig. 1.
Fig. 1.
Data quality, hit selection, and validation. Enrichment of shRNAs targeting known positive regulators of FAS-dependent apoptosis. (A) Representative pool deconvolution data derived from Illumina sequencing comparing the log2 ratio of FASL-treated vs. control samples relative to the log10-converted P value calculated for each shRNA. The shRNAs targeting CASP3, CASP8, FAS, and FADD are highlighted. (B) The enrichment of shRNAs targeting CASP8 and FADD as determined by sequencing or array based deconvolution (Top) correlates with the degree of silencing for both genes (Bottom, Western blots; numbers represent CASP8 or FADD shRNAs; L, G, and N represent control shRNAs targeting luciferase, GAPDH, or a scrambled sequence, respectively). The P value for both FADD and CASP8 shRNA enrichment was lower than 0.005 for all shRNAs shown except CASP8 shRNA 3. (C) Hit selection criteria consisted of threefold change plus a P value < 0.02 for the array data and a fourfold change plus a P value lower than 0.02 for sequencing data. A representative figure highlighting the hits selected from the sequencing data is shown. (D) Comparison of the primary pooled shRNA data with a follow-up secondary assay using individual shRNAs. The top hits from the primary screen were tested in an arrayed 96-well format as described in Materials and Methods. Data shown are represented as fold change (FASL/control) comparing the individually arrayed shRNAs (“Arrayed”) vs. the selected shRNA's performance in the primary screen (“Pooled”). Highlighted in yellow are shRNAs that met the arrayed validation threshold (P < 0.05 and fold change >1.5); the fold change and P values for these hits are listed in Dataset S1.
Fig. 2.
Fig. 2.
Validation of top depleted primary hits using siRNAs. (A) The top depleted hits from the primary and secondary screen were validated with a tertiary assay by using siRNA pools as described in Materials and Methods. After transfection with the indicated siRNA, cells were treated with FASL, dulanermin, TNF, or etoposide, and the impact on cell viability quantified with Cell-Titer Glo. A representative experiment is shown in which each sample was performed in replicates of six. A dotted line indicates the threshold for sensitization set at 1.5 fold over controls. (B) The siRNA pools for PTK7, UNC13D, TAOK2, EDD1, and GRHL2 were deconvoluted and individually transfected into HT1080 cells. The impact on sensitivity to FASL-mediated apoptosis was determined as described earlier. A dotted line indicates the threshold for sensitization set at 1.5 fold over controls. The fold change and P values calculated for Fig. 2 A and B are listed in Dataset S1. (C) Confirmation of on-target silencing for each siRNA by using a gene-specific quantitative RT-PCR analysis 72 h after transfection. The relative expression of each gene was normalized to the expression of HPRT and is displayed relative to nontargeting control siRNA-transfected cells. A representative experiment is shown in which each sample was performed in triplicate, with the error bars representing the SD of the mean.
Fig. 3.
Fig. 3.
EDD1 and GRHL2 reside within an amplicon present on chromosome 8q22. (A) A heat map of copy number for chromosome 8 in breast tumors. Tumor samples are represented as rows and grouped based on hierarchical clustering of copy number profiles. The tumor classification of triple negative, hormone receptor-positive (HR+), and HER2+ are noted on the left axis in blue, green, and red, respectively. Log2 ratios from GLAD segmentation are color-coded based on the scale shown on the right (red represents gain and blue represents loss). (B) A GISTIC analysis of chromosome 8 was performed as described in Materials and Methods across a panel of breast, lung, ovarian, and melanoma tumor samples. The locations of EDD1 and GRHL2 in A and B are highlighted with yellow and green lines, respectively. Copy number data have been deposited in the Gene Expression Omnibus database (accession no. GSE20393). (C) The expression of EDD1 and GRHL2 correlates with genomic copy number gains across a panel of breast cancer cell lines.
Fig. 4.
Fig. 4.
Silencing EDD1 or GRHL2 increases cell surface FAS (A) and DR5 (B) expression in HT1080 cells. FAS and DR5 expression levels were determined 72 h after transfection with two independent siRNAs targeting the indicated gene: EDD1, E_si1 and E_si4; and GRHL2, G_si3 and G_si4. (C and D) To demonstrate the ability to rescue the RNAi knock-down of endogenous EDD1, the target sequence for a single siRNA (E_si2) was disrupted with multiple silent mutations and cloned into a viral vector enabling doxycycline-regulated expression of a FLAG-tagged EDD1 protein. A stable pool of HT1080 cells was generated and cultured in the presence or absence of doxycycline (Dox) to induce EDD1 expression. Three days after doxycycline addition, cells were transfected with siNTC or EDD1 siRNAs (E_si1 or E_si2). (C) Left: Western blot demonstrates resistance of the doxycycline-regulated EDD1 to silencing by E_si2 but not E_si1. Right: Effect of silencing endogenous EDD1 on FAS or DR5 expression was compared with cells expressing the RNAi-resistant EDD1 (doxycycline-treated cells) by FACS. (D) Expression of an RNAi-resistant FLAG-EDD1 rescues the enhanced sensitivity to FASL upon silencing endogenous EDD1. HT1080 cells were cultured in the presence or absence of doxycycline for 3 d, followed by transfection with siNTC, E_si1 (an siRNA that silences endogenous and Flag-tagged EDD1), and E_si2 (which silences only endogenous EDD1). Three days after siRNA transfection, cells were treated with or without 150 ng/mL FASL and the level of activated CASP3/7 was quantified. The data presented in D are displayed as a ratio between CASP3/7 activity levels relative to the number of viable cells. A representative experiment is shown in which each sample was performed in triplicate, with the error bars representing SD of the mean.
Fig. 5.
Fig. 5.
EDD1 expression correlates with resistance of cancer cell lines to dulanermin. (A) EDD1 mRNA expression is significantly elevated in dulanermin-resistant compared with dulanermin-sensitive breast (P = 0.0097) and pancreatic (P = 0.012) cancer cell lines and is moderately elevated in lung cancer cell lines (P = 0.098). Microarray gene expression data were generated across a panel of dulanermin-sensitive and -resistant cell lines as described previously (7). Sensitivity to dulanermin was classified by using an IC50 threshold of 1 μg/mL. Cell lines with an IC50 greater than 1 μg/mL were classified as resistant, whereas those with an IC50 lower than 1 μg/mL were classified as sensitive to dulanermin. (B) Comparison of EDD1 and GRHL2 protein expression across a panel of dulanermin-resistant and -sensitive breast cancer cell lines. The copy number gain of the 8q22 amplicon is indicated above each cell line. The blots were reprobed for ACTIN as a loading control. (C) The protein expression of EDD1 and GRHL2 was quantified and normalized to ACTIN within each cell line. The expression fold change was calculated by comparison with normal human mammary epithelial cells (HMEC).
Fig. 6.
Fig. 6.
EDD1 and GRHL2 expression regulate the sensitivity of breast cancer cells to dulanermin-induced apoptosis. (A) Silencing EDD1 or GRHL2 enhances dulanermin-induced apoptosis. The indicated dulanermin-resistant and 8q22-amplified breast cancer cell lines were treated with dulanermin 72 h after transfection with the siRNAs targeting the noted gene. Data are displayed as a ratio between CASP3/7 activity levels relative to the number of viable cells in the absence of dulanermin. A representative experiment is shown in which each sample was performed in triplicate, with the error bars representing SD of the mean. (B) The impact of silencing EDD1 and GRHL2 on DR5 expression correlates with the degree of sensitization to dulanermin. Quantitative RT-PCR analysis was performed 72 h after transfection with the indicated siRNA. The relative expression of each gene was normalized to the expression of HPRT and is displayed relative to siNTC transfected cells.
Fig. P1.
Fig. P1.
A genome shRNA screen identifies novel negative regulators of death receptor apoptosis. (A) Flow chart of the primary screen using a pooled whole-genome shRNA library. Nine days after treating cells with or without FASL, the integrated shRNAs were recovered by PCR and deconvoluted using sequencing and custom arrays. (B) EDD1 and GRHL2 reside within an amplicon present on chromosome 8q22. A GISTIC analysis of chromosome 8 highlights the amplification of EDD1 and GRHL2 in breast tumor samples. Data are displayed as copy number (Q value) vs. chromosome position. (C and D) EDD1 and GRHL2 inhibit the sensitivity to death receptor-induced apoptosis by regulating the receptor expression. A Western blot shows the induction of FAS expression upon silencing of EDD1 or GRHL2 (C), and a model proposes the mechanism by which EDD1 and GRHL2 have an impact on the sensitivity to apoptosis (D).

References

    1. Hanahan D, Weinberg RA. The hallmarks of cancer. Cell. 2000;100:57–70. - PubMed
    1. Kang MH, Reynolds CP. Bcl-2 inhibitors: Targeting mitochondrial apoptotic pathways in cancer therapy. Clin Cancer Res. 2009;15:1126–1132. - PMC - PubMed
    1. Ashkenazi A. Directing cancer cells to self-destruct with pro-apoptotic receptor agonists. Nat Rev Drug Discov. 2008;7:1001–1012. - PubMed
    1. Ashkenazi A, Dixit VM. Death receptors: Signaling and modulation. Science. 1998;281:1305–1308. - PubMed
    1. Nagata S. Apoptosis by death factor. Cell. 1997;88:355–365. - PubMed

MeSH terms

Associated data

LinkOut - more resources