. 2011 Oct 4;108(40):16807-12.
doi: 10.1073/pnas.1113648108. Epub 2011 Sep 26.

Inhibitory interneurons in a cortical column form hot zones of inhibition in layers 2 and 5A

Affiliations

Inhibitory interneurons in a cortical column form hot zones of inhibition in layers 2 and 5A

Hanno S Meyer et al. Proc Natl Acad Sci U S A. .

Abstract

Although physiological data on microcircuits involving a few inhibitory neurons in the mammalian cerebral cortex are available, data on the quantitative relation between inhibition and excitation in cortical circuits involving thousands of neurons are largely missing. Because the distribution of neurons is very inhomogeneous in the cerebral cortex, it is critical to map all neurons in a given volume rather than to rely on sparse sampling methods. Here, we report the comprehensive mapping of interneurons (INs) in cortical columns of rat somatosensory cortex, immunolabeled for neuron-specific nuclear protein and glutamate decarboxylase. We found that a column contains ~2,200 INs (11.5% of ~19,000 neurons), almost a factor of 2 less than previously estimated. The density of GABAergic neurons was inhomogeneous between layers, with peaks in the upper third of L2/3 and in L5A. IN density therefore defines a distinct layer 2 in the sensory neocortex. In addition, immunohistochemical markers of IN subtypes were layer-specific. The "hot zones" of inhibition in L2 and L5A match the reported low stimulus-evoked spiking rates of excitatory neurons in these layers, suggesting that these inhibitory hot zones substantially suppress activity in the neocortex.


Conflict of interest statement

The authors declare no conflict of interest.

Figures
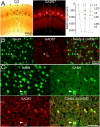
Fig. 1.
Fig. 1.
Identification of columns, neurons, and INs. (A) (Left) Bright-field image of a CO-stained semicoronal barrel cortex slice (100-μm thickness, right hemisphere, P27 rat). Note barrels as dark patches in L4. Borders of cortical columns were extrapolated from the lateral barrel borders (dashed lines). (Center) Epifluorescence image of the subsequent slice (50 μm), immunolabeled for GAD67. Note clearly visible barrels (Fig. S1). (Right) Column and layer outlines from the CO staining (black) and GAD67 staining (green). (B) Fluorescence images of a slice immunolabeled for NeuN and GAD67 and an overlay. A GABAergic IN (filled arrow) and GAD67-negative (excitatory) neuron (open arrow) are indicated. (C) Fluorescence images of a slice immunolabeled for GABA in addition to NeuN and GAD67. The filled arrow shows a GABA- and GAD67-positive neuron; the open arrow shows a GABA- and GAD67-negative neuron; and the dashed arrow shows a GAD67-positive and GABA-ambiguous neuron. All images in B and C show one confocal imaging plane. (Scale bar: 50 μm.)
Fig. 2.
Fig. 2.
Distribution of excitatory neurons and INs in cortical columns. (A) Distribution of NeuN-positive somata in one semicoronal slice (thickness of 50 μm, 9,801 manually placed markers). Dashed lines show column and layer borders determined by GAD67 staining (Fig. 1A). Note the barrel-aligned patches of high neuron density in L4 (Fig. S2A). (B) Distribution of GAD67-positive somata in the same slice (1,209 markers; Fig. S2B). Maps of average excitatory neuron density (C) and GAD67-positive IN density (D) from five slices centered at the D2 column, aligned to the D2 barrel center (Materials and Methods and Fig. S3). Note the two IN “hot zones” in L2 and upper L5 defined by high IN density, whereas IN density in L3, L4, and lower L6 is low. (Color scale bar range: C, 0–140,000 per mm3; D, 0–18,500 per mm3.) (E) IN density distribution along the D2 vertical column axis (red), mean excitatory neuron density (black), and individual density profiles from the five slices (gray). Layer borders were determined by differences in excitatory neuron density (dashed horizontal lines). (F) Mean IN density profile (as in E), with a sharp peak in supragranular layers defining a cytoarchitectonic layer 2 (Inset). (G) IN-to-neuron ratio along the vertical column axis (D2 column). Red markers in A and B indicate a blood vessel.
Fig. 3.
Fig. 3.
IN distribution in three complete cortical columns. Projection in a semicoronal plane of 66,422 NeuN-positive (A) and 7,389 GAD67-positive (B) soma markers in a region comprising the entire D2 and C2 columns. Dashed lines represent barrel outlines in the tangential plane. Note the high density of INs in L2 and L5A. (C) Neuron distribution (Left) and IN distribution (Right) in the C2 column, rotated to the vertical column axis. (D) IN distribution in three complete columns (C2, D2, and D3: red, green, and blue, respectively). Dashed lines represent vertical column axes, and white lines represent barrel outlines. a.l., anterior-lateral; b., basal; c.l., caudal-lateral. (E) Overlay of the 6,686 INs counted in three columns (D), aligned to the column axis and the pial surface and centered (in the tangential plane) to the barrel center. (F) Distribution of INs in the tangential plane. Density maps at varying depths from the pia (dashed white lines in E). Note the ring-like distribution of INs at 50–150 μm from the pia (corresponding to the “arcs” seen in the semicoronal plane; Fig. 2D). (Scale bars: 200 μm.)
Fig. 4.
Fig. 4.
Distribution of IN somata immunoreactive for PV, SOM, and CR. Average density maps of PV-positive (A), SOM-positive (B), and CR-positive (C) INs in slices from the D2 and C2 columns (compare with Fig. S4). (D) Distribution of the IHC IN types along the vertical column axis (D2 column; variability between individual slices is shown in Fig. S5). Note that PV-positive INs are most dense in lower L4; SOM-positive INs are most dense in L5A, L3 and upper L6; and CR-positive IN density has a peak in L2 and L5B. (E) Vertical profile of the fraction of IHC IN types (compared with all INs in the D2 column). Note that in all layers except for L6B, PV-positive INs are most abundant and the majority of INs are negative for all three tested markers (sum of ratios, black line) in L2, although IN density is highest (Fig. 2 DG). Only in lower L3, L4, and upper L6A can the three IN markers account for all INs. (Color scale bar, neuron density range: A, 0–11,000 per mm3; B, 0–6,000 per mm3; C, 0–4,000 per mm3.)

Similar articles

Cited by

References

    1. Pouille F, Scanziani M. Enforcement of temporal fidelity in pyramidal cells by somatic feed-forward inhibition. Science. 2001;293:1159–1163. - PubMed
    1. Brecht M, Roth A, Sakmann B. Dynamic receptive fields of reconstructed pyramidal cells in layers 3 and 2 of rat somatosensory barrel cortex. J Physiol. 2003;553:243–265. - PMC - PubMed
    1. Brecht M, Sakmann B. Dynamic representation of whisker deflection by synaptic potentials in spiny stellate and pyramidal cells in the barrels and septa of layer 4 rat somatosensory cortex. J Physiol. 2002;543:49–70. - PMC - PubMed
    1. Manns ID, Sakmann B, Brecht M. Sub- and suprathreshold receptive field properties of pyramidal neurones in layers 5A and 5B of rat somatosensory barrel cortex. J Physiol. 2004;556:601–622. - PMC - PubMed
    1. de Kock CP, Bruno RM, Spors H, Sakmann B. Layer- and cell-type-specific suprathreshold stimulus representation in rat primary somatosensory cortex. J Physiol. 2007;581:139–154. - PMC - PubMed

Substances

LinkOut - more resources