Complex genetic architecture of Drosophila aggressive behavior
- PMID: 21949384
- PMCID: PMC3193212
- DOI: 10.1073/pnas.1113877108
Complex genetic architecture of Drosophila aggressive behavior
Abstract
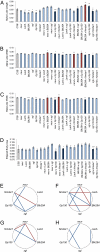
Epistasis and pleiotropy feature prominently in the genetic architecture of quantitative traits but are difficult to assess in outbred populations. We performed a diallel cross among coisogenic Drosophila P-element mutations associated with hyperaggressive behavior and showed extensive epistatic and pleiotropic effects on aggression, brain morphology, and genome-wide transcript abundance in head tissues. Epistatic interactions were often of greater magnitude than homozygous effects, and the topology of epistatic networks varied among these phenotypes. The transcriptional signatures of homozygous and double heterozygous genotypes derived from the six mutations imply a large mutational target for aggressive behavior and point to evolutionarily conserved genetic mechanisms and neural signaling pathways affecting this universal fitness trait.
Conflict of interest statement
The authors declare no conflict of interest.
Figures


Similar articles
-
Genetic architecture of natural variation in Drosophila melanogaster aggressive behavior.Proc Natl Acad Sci U S A. 2015 Jul 7;112(27):E3555-63. doi: 10.1073/pnas.1510104112. Epub 2015 Jun 22. Proc Natl Acad Sci U S A. 2015. PMID: 26100892 Free PMC article.
-
Epistatic partners of neurogenic genes modulate Drosophila olfactory behavior.Genes Brain Behav. 2016 Feb;15(2):280-90. doi: 10.1111/gbb.12279. Epub 2016 Jan 18. Genes Brain Behav. 2016. PMID: 26678546 Free PMC article.
-
A transcriptional network associated with natural variation in Drosophila aggressive behavior.Genome Biol. 2009;10(7):R76. doi: 10.1186/gb-2009-10-7-r76. Epub 2009 Jul 16. Genome Biol. 2009. PMID: 19607677 Free PMC article.
-
Genetics of aggression.Annu Rev Genet. 2012;46:145-64. doi: 10.1146/annurev-genet-110711-155514. Epub 2012 Aug 28. Annu Rev Genet. 2012. PMID: 22934647 Review.
-
Epistasis for quantitative traits in Drosophila.Methods Mol Biol. 2015;1253:47-70. doi: 10.1007/978-1-4939-2155-3_4. Methods Mol Biol. 2015. PMID: 25403527 Review.
Cited by
-
The complex genetic architecture of male mate choice evolution between Drosophila species.Heredity (Edinb). 2020 Jun;124(6):737-750. doi: 10.1038/s41437-020-0309-9. Epub 2020 Mar 20. Heredity (Edinb). 2020. PMID: 32203250 Free PMC article.
-
Genetic architecture of natural variation in visual senescence in Drosophila.Proc Natl Acad Sci U S A. 2016 Oct 25;113(43):E6620-E6629. doi: 10.1073/pnas.1613833113. Epub 2016 Oct 10. Proc Natl Acad Sci U S A. 2016. PMID: 27791033 Free PMC article.
-
Volatile Drosophila cuticular pheromones are affected by social but not sexual experience.PLoS One. 2012;7(7):e40396. doi: 10.1371/journal.pone.0040396. Epub 2012 Jul 11. PLoS One. 2012. PMID: 22808151 Free PMC article.
-
The road less traveled: from genotype to phenotype in flies and humans.Mamm Genome. 2018 Feb;29(1-2):5-23. doi: 10.1007/s00335-017-9722-7. Epub 2017 Oct 20. Mamm Genome. 2018. PMID: 29058036
-
DGRPool, a web tool leveraging harmonized Drosophila Genetic Reference Panel phenotyping data for the study of complex traits.Elife. 2024 Oct 21;12:RP88981. doi: 10.7554/eLife.88981. Elife. 2024. PMID: 39431984 Free PMC article.
References
-
- Mackay TFC, Stone EA, Ayroles JF. The genetics of quantitative traits: Challenges and prospects. Nat Rev Genet. 2009;10:565–577. - PubMed
-
- Carlborg O, Jacobsson L, Ahgren P, Siegel P, Andersson L. Epistasis and the release of genetic variation during long-term selection. Nat Genet. 2006;38:418–420. - PubMed
-
- Falconer DS, Mackay TFC. Introduction to Quantitative Genetics. Addison, Wesley, Longman, Harlow, Essex, UK; 1996.
-
- Wagner GP, Zhang J. The pleiotropic structure of the genotype-phenotype map: The evolvability of complex organisms. Nat Rev Genet. 2011;12:204–213. - PubMed
Publication types
MeSH terms
Grants and funding
LinkOut - more resources
Full Text Sources
Other Literature Sources
Molecular Biology Databases

