. 2011 Oct 25;108(43):E952-61.
doi: 10.1073/pnas.1104969108. Epub 2011 Sep 26.

Sir-two-homolog 2 (Sirt2) modulates peripheral myelination through polarity protein Par-3/atypical protein kinase C (aPKC) signaling

Affiliations

Sir-two-homolog 2 (Sirt2) modulates peripheral myelination through polarity protein Par-3/atypical protein kinase C (aPKC) signaling

Bogdan Beirowski et al. Proc Natl Acad Sci U S A. .

Abstract

The formation of myelin by Schwann cells (SCs) occurs via a series of orchestrated molecular events. We previously used global expression profiling to examine peripheral nerve myelination and identified the NAD(+)-dependent deacetylase Sir-two-homolog 2 (Sirt2) as a protein likely to be involved in myelination. Here, we show that Sirt2 expression in SCs is correlated with that of structural myelin components during both developmental myelination and remyelination after nerve injury. Transgenic mice lacking or overexpressing Sirt2 specifically in SCs show delays in myelin formation. In SCs, we found that Sirt2 deacetylates Par-3, a master regulator of cell polarity. The deacetylation of Par-3 by Sirt2 decreases the activity of the polarity complex signaling component aPKC, thereby regulating myelin formation. These results demonstrate that Sirt2 controls an essential polarity pathway in SCs during myelin assembly and provide insights into the association between intracellular metabolism and SC plasticity.


Conflict of interest statement

Conflict of interest statement: The authors and Washington University may derive benefit from a licensing agreement with Sirtris Pharmaceuticals, which did not provide any support for this work.

Figures

Fig. 1.
Fig. 1.
Dynamic expression of Sirt2 in SCs and generation of Sirt2-SCKO mice. (A) Representative fluorescence microscopy of immunostained rat Schwann cell in vitro showing cytoplasmic localization of Sirt2 (green). (Scale bar: 10 μm.) (B–D) Fluorescence microscopy of rat teased fiber preparations following immunolabeling with antibodies against Sirt2 (red), E-cadherin (E-cad) (green), and NaV sodium channel (green). Arrows point to Sirt2 signal. Note detection of Sirt2 in regions of noncompact myelin and colocalization of Sirt2 (D1) and E-cadherin (D2) at Schmidt–Lanterman incisures (arrowheads). (Scale bars: 2 μm.) (E and F) Graphs showing relative Sirt1, Sirt2, and MPZ mRNA levels (normalized to GAPDH expression) in mouse postnatal nerves (E) and distal nerve stumps at the indicated times (days) after crush injury (F) (n = 9 mice for each group tested). (G) Western blots from sciatic nerve extracts from postnatal and adult mouse probed with antibodies against Sirt2, MBP, MPZ, Egr2, and β-actin (loading control). (H) Schematic illustration of the conditional Sirt2 allele with loxP sequences (red) flanking exons 5–7 (black). The neomycin selection marker cassette (NEO, blue) is flanked by Flp recombinase recognition sequences (FRT sites). (I) Longitudinal sciatic nerve section from mouse carrying the Sirt2flox and ROSA26-YFP alleles and expressing Cre recombinase under control of the MPZ promoter. The section was immunolabeled with anti-βIIItubulin antibody (red) to visualize axons apposed to the YFP signal derived from the ROSA allele after activation in SCs by Cre recombinase expression (green). (Scale bar: 50 μm.) (J) qRT-PCR quantification of relative Sirt2 transcript levels (normalized to GAPDH expression) in sciatic nerves from Sirt2-SCKO mutants and Sirt2fl/fl control mice without Cre recombinase expression (n = 3 mice per group tested) (*P < 0.01). (K) Western blot from sciatic nerve lysates of 2-wk-old Sirt2fl/fl control and Sirt2-SCKO mice probed with antibodies against Sirt2 and β-actin (loading control).
Fig. 2.
Fig. 2.
Sirt2-SCKO mice display hypomyelination. (A) Representative electron micrographs from transverse sciatic nerve ultrathin section from Sirt2-SCKO mutants and Sirt2fl/fl control mice at postnatal ages P1, P3, and P5. Note reduction in the number of myelinated fibers in Sirt2-SCKO preparations. (Scale bar: 10 μm.) (B and C) Histomorphometric quantification of myelinated fiber numbers (B) and g-ratios (C) in transverse sciatic nerve sections from Sirt2-SCKO mutants and Sirt2fl/fl control mice at postnatal ages P1–P28 (n = 3–5 mice per group tested) (*P < 0.05). (D) Representative light (Upper) and electron (Lower) microscopy of distal sciatic nerve stumps 14 d after nerve crush injury. Red arrows point to regenerated fibers. Note thinner myelin sheaths or complete absence of compact myelin (asterisks) in axons from adult Sirt2-SCKO mice compared with Sirt2fl/fl controls. Blue arrowheads point to macrophages with typical cytoplasmic vacuolation due to phagocytosis. [Scale bars: 20 μm (light microscopy) and 2 μm (electron microscopy).] (E and F) Quantification of g-ratios (E) and fiber numbers (F) in distal sciatic nerve stumps at different time points after nerve crush injury in Sirt2-SCKO mice and Sirt2fl/fl controls (n = 7–8 mice per group tested) (*P < 0.05).
Fig. 3.
Fig. 3.
Sirt2 deacetylates Par-3 and thereby regulates aPKC activation. (A) Fluorescence microscopy of rat teased fiber preparation immunolabeled with Sirt2 (red) and Par-3 (green) antibodies. Note colocalization of both signals along internode (indicated by arrows). (Scale bar: 5 μm.) (B) Pull-down assay using anti–FLAG-M2 agarose affinity gel and transfected HEK 293T cells overexpressing FLAG-Par-3 or Sirt2-HA or both. Western blots from cell lysates and immunoprecipitates were probed with anti-HA and anti-FLAG antibodies. (C) Pull-down assay using anti–FLAG-M2 agarose affinity gel and transfected HEK 293T cells overexpressing Sirt2-HA, p300 acetyltransferase, or FLAG-Par-3 or combinations of these constructs. Western blots from cell lysates and immunoprecipitates were probed with anti–acetyl-lysine, anti-FLAG, anti-p300, and anti-HA antibodies. Note that binding between Sirt2 and Par-3 is not observable in this experiment due to the lower concentration of FLAG-Par-3 in the immunoprecipitate compared with that in B. (D) Western blots from in vitro Par-3 deacetylation assay using a recombinant human wild-type or point-mutated and therefore deacetylase-deficient Sirt2 (HY) variant. Following Par-3 immunoprecipitation from transfected cells, incubations with recombinant Sirt2 constructs were carried out in the presence of NAD+, NAM, NAD+ + NAM, or vehicle control as indicated. The blots were probed with anti–acetyl-lysine, anti-FLAG, and anti-polyhistidine antibodies. (E) Schematic illustrating the position of the Sirt2-mediated lysine acetylation sites identified by tandem mass spectrometry relative to individual Par-3 domains responsible for interaction with aPKC, Par-6, and p75NTR. (F) Western blots from SC lysates and anti-Par-3 immunoprecipitates probed with antibodies against phospho-aPKC, aPKC, Sirt2, acetyl-lysine, and Par-3. SCs were infected with lentivirus for Sirt2 overexpression and were treated with NAD+ (1 mM), NAM (5 mM), or vehicle beforehand as indicated. WCL: whole-cell lysate. (G, Upper) Western blots from 2-mo-old Sirt2-SCKO and littermate control sciatic nerve lysates and Par-3 immunoprecipitates probed with antibodies against acetyl-lysine, phospho-aPKC, aPKC, Sirt2, and β-actin (loading control). (Lower) Densitometry was used to quantify the intensities of the signals detected above. Sirt2 was normalized to β-actin, phospho-aPKC was normalized to total aPKC, and acetyled Par-3 was normalized to total Par-3 and expressed as percentage of the corresponding signal detected in Sirt2fl/fl control samples. (H) Western blots from mouse sciatic nerve lysates and Par-3 immunoprecipates probed with antibodies against acetyl-lysine, phospho-aPKC, aPKC, Sirt2, and Par-3. Sciatic nerve distal stumps were dissected 7, 14, and 21 d following crush lesion and compared with unlesioned nerve preparation (C0).
Fig. 4.
Fig. 4.
Characterization of Sirt2-SCTG mice. (A) Schematic representation of the Sirt2 transgenic construct that was targeted to the 3′-UTR of the collagen A1 locus of mouse embryonic stem cells by FLP recombination. Transgenic mice carrying this construct were crossed to MPZ-Cre transgenic mice and were bred to homozygosity to generate Sirt2-SCTG mutants and Sirt2STOP controls without Cre recombinase expression. (B) qRT-PCR quantification of relative Sirt2 transcript levels (normalized to GAPDH) in sciatic nerves from Sirt2-SCTG transgenics and Sirt2STOP control mice at P7 and 2 mo after birth (n = 3 mice per group tested) (*P < 0.05). (C, Upper) Western blots from 2-mo-old Sirt2-SCTG and littermate control sciatic nerve lysates and Par-3 immunoprecipitates probed with antibodies recognizing Sirt2, β-actin (loading control), phospho-aPKC, aPKC, acetyl-lysine, and Par-3. Note that exposure time at (*) was much longer than in the Western blot shown in Fig. 3G to visualize the difference in phospho-aPKC levels in Sirt2-SCTG and littermate control mice. (Lower) Densitometry was used to quantify the intensities of the signals detected above. Sirt2 was normalized to β-actin, phospho-aPKC was normalized to total aPKC, and acetyled Par-3 was normalized to total Par-3 and expressed as percentage of the corresponding signal detected in Sirt2STOP control samples. (D and E) Quantification of g-ratios and fiber numbers in distal sciatic nerve stumps 14 d after nerve crush injury in Sirt2-SCTG transgenics and Sirt2STOP control mice (n = 8 mice per group tested) (*P < 0.05). (F) Transmission electron microscopy of ultrathin sections from distal sciatic nerve stumps 14 d after nerve crush injury in Sirt2-SCTG transgenic and Sirt2STOP control mouse. Arrows point to regenerated fibers. Note thinner compact myelin sheaths around axons from the Sirt2-SCTG preparation. (Scale bar: 2 μm.)
Fig. 5.
Fig. 5.
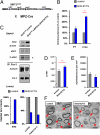
Manipulation of Sirt2 expression, Par-3 acetylation, and aPKC activation produces myelination abnormalities in DRG/SC cocultures. (A) Representative phase-contrast (PC) and fluorescence microscopy from MBP-labeled rat DRG/SC cocultures highlighting myelin profiles on neurites. Before induction of in vitro myelination isolated rat SCs were infected with lentivirus expressing Sirt2 or luciferase (control) siRNA. (Scale bar: 100 μm.) (B) Quantification of myelin profiles from in vitro myelination experiments after knockdown of Sirt1 and Sirt2 (Left) or overxpression of Sirt2 in SCs (Right) (*P < 0.001). The results are expressed as percentage of myelination compared with control preparations in which SCs were infected with luciferase siRNA or with empty lentiviral vector (FCIV), respectively. (Upper) Knockdown of Sirt2 using two different siRNA target constructs was confirmed by Western blotting. (C) Quantification of myelin profiles from in vitro myelination experiments after knockdown of rPar-3 in rat SCs and concomitant expression of mouse Par-3 constructs (wild-type mPar-3 or mutant mPar-3(4Q) mimicking constitutive acetylation). Control preparations were infected with lentivirus for expression of EGFP or luciferase siRNA (*P < 0.01). (Upper) Equal expression of the mouse wild-type and mutant Par-3 proteins in the infected SCs was confirmed by Western blotting. (D) Quantification of myelin profiles from in vitro myelination experiments after treatment with aPKCζ inhibitor at the induction of myelination by ascorbate addition (early treatment) or 7 d after ascorbate addition (late treatment) (*P < 0.01; **P < 0.005). (E) Quantification of myelin profiles from in vitro myelination experiments after overexpression of constitutive active PKCζ(T410E). Control preparations were infected with lentivirus expressing EGFP (*P < 0.005).
Fig. 6.
Fig. 6.
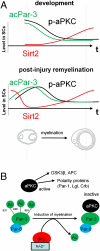
Molecular modulation of peripheral myelination by the Sirt2/Par-3/aPKC pathway. (A) Schematic graphs summarizing the progression of Sirt2 expression, Par-3 acetylation, and phospho-aPKC levels during developmental myelination and remyelination after nerve injury in adult mice. (B) Model based on the profiles shown in A illustrating how decreases in Par-3 acetylation due to elevated Sirt2 levels result in aPKC inactivation and effects on downstream targets that control myelin assembly in SCs. Such targets include other polarity proteins (e.g., such as Par-1, Lgl, and Crb), signaling molecules, and cytoskeletal regulatory proteins (e.g., GSK3β and APC); see Discussion for details.
Fig. P1.
Fig. P1.
Molecular regulation of peripheral myelination by the Sirt2/Par-3/aPKC pathway in SCs: Model illustrating how a decrease in Par-3 acetylation by elevation of Sirt2 levels during myelination results in aPKC inactivation and downstream effects on myelin assembly in SCs.

References

    1. Nave KA. Myelination and support of axonal integrity by glia. Nature. 2010;468:244–252. - PubMed
    1. Fawcett JW, Keynes RJ. Peripheral nerve regeneration. Annu Rev Neurosci. 1990;13:43–60. - PubMed
    1. Jessen KR, Mirsky R. Control of Schwann cell myelination. F1000 Biol Rep. 2010;2:19. - PMC - PubMed
    1. Le N, et al. Nab proteins are essential for peripheral nervous system myelination. Nat Neurosci. 2005;8:932–940. - PubMed
    1. Ekström AR, Tomlinson DR. Impaired nerve regeneration in streptozotocin-diabetic rats. Effects of treatment with an aldose reductase inhibitor. J Neurol Sci. 1989;93:231–237. - PubMed

Publication types

MeSH terms