. 2011 Oct 3;195(1):131-45.
doi: 10.1083/jcb.201008013. Epub 2011 Sep 26.

EMILIN1-α4/α9 integrin interaction inhibits dermal fibroblast and keratinocyte proliferation

Affiliations

EMILIN1-α4/α9 integrin interaction inhibits dermal fibroblast and keratinocyte proliferation

Carla Danussi et al. J Cell Biol. .

Abstract

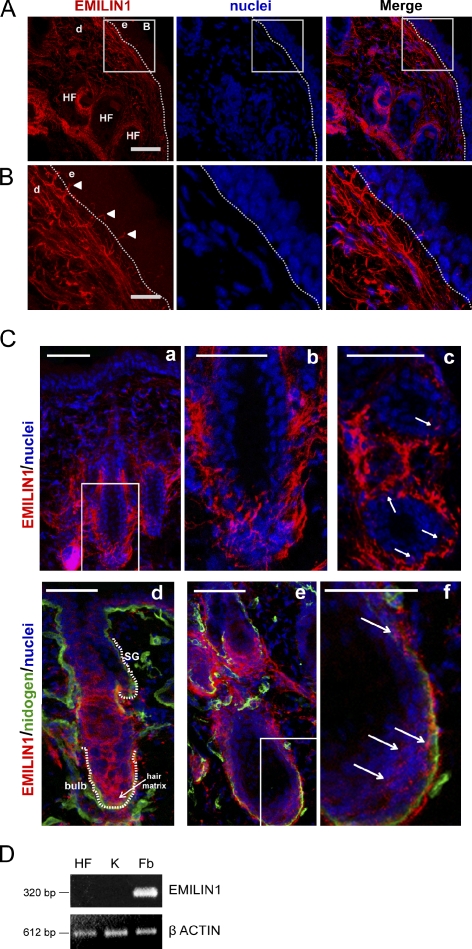
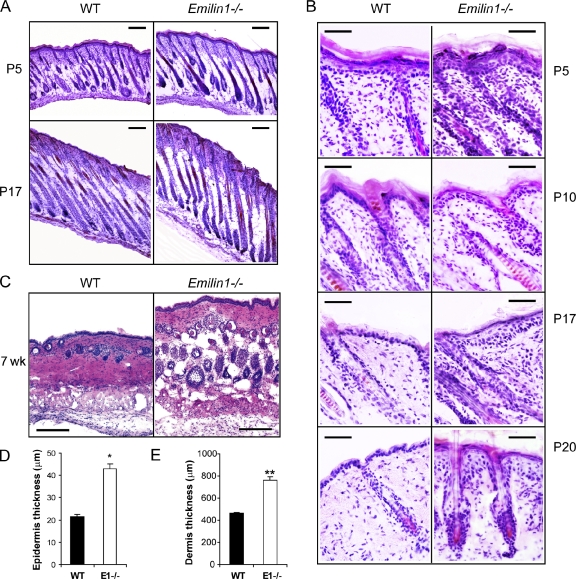
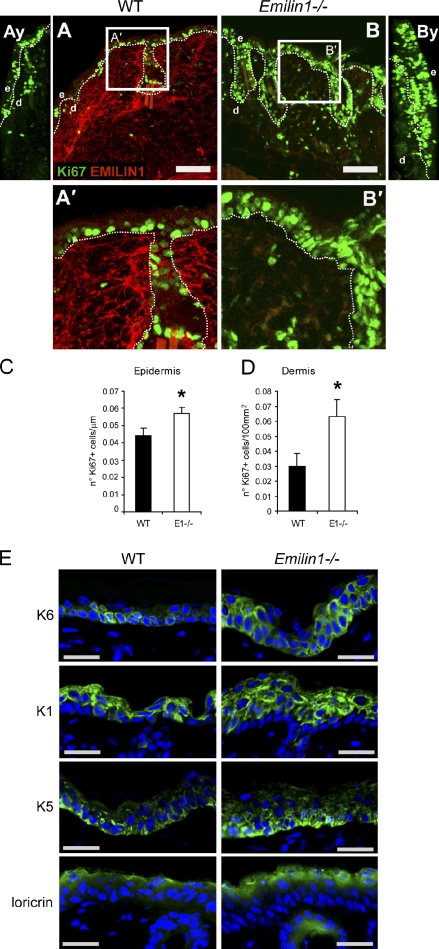
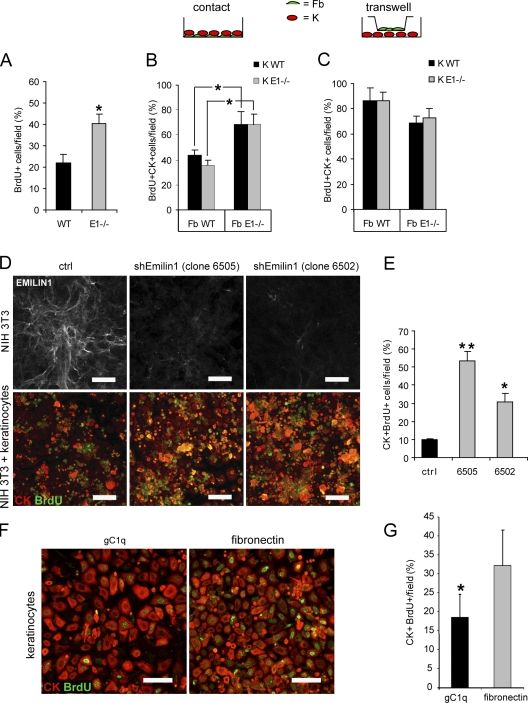
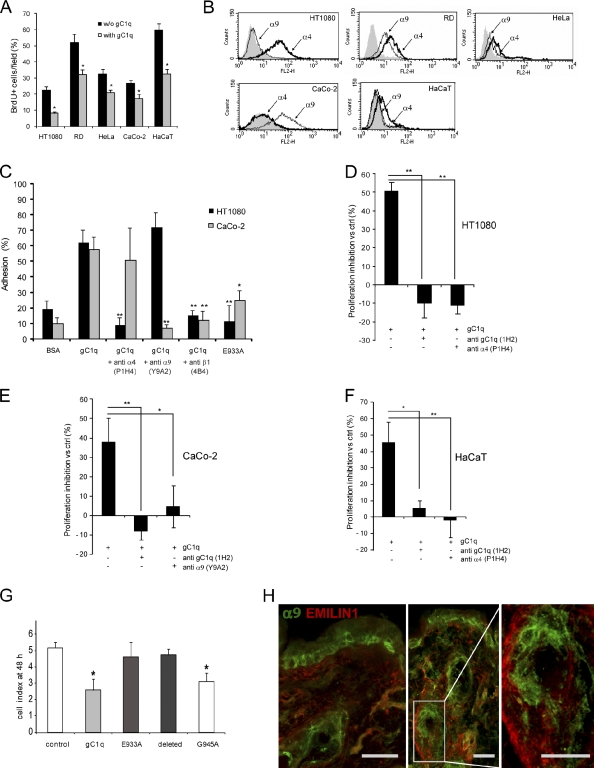
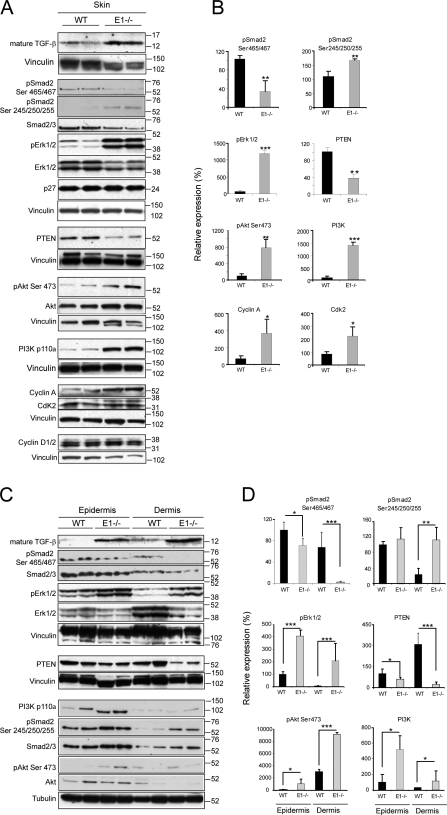
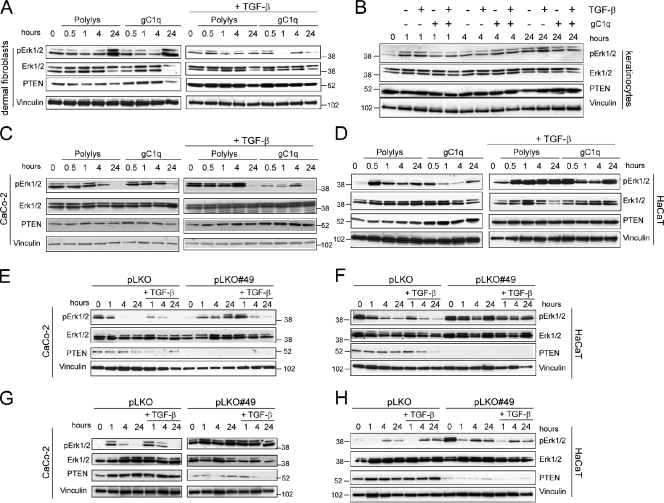
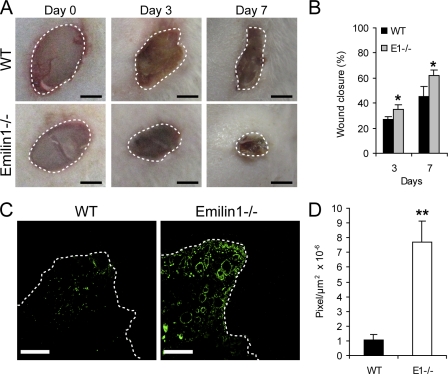
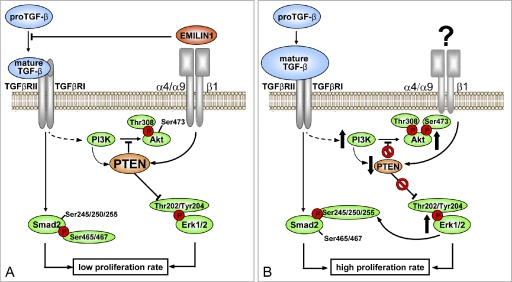
EMILIN1 promotes α4β1 integrin-dependent cell adhesion and migration and reduces pro-transforming growth factor-β processing. A knockout mouse model was used to unravel EMILIN1 functions in skin where the protein was abundantly expressed in the dermal stroma and where EMILIN1-positive fibrils reached the basal keratinocyte layer. Loss of EMILIN1 caused dermal and epidermal hyperproliferation and accelerated wound closure. We identified the direct engagement of EMILIN1 to α4β1 and α9β1 integrins as the mechanism underlying the homeostatic role exerted by EMILIN1. The lack of EMILIN1-α4/α9 integrin interaction was accompanied by activation of PI3K/Akt and Erk1/2 pathways as a result of the reduction of PTEN. The down-regulation of PTEN empowered Erk1/2 phosphorylation that in turn inhibited Smad2 signaling by phosphorylation of residues Ser245/250/255. These results highlight the important regulatory role of an extracellular matrix component in skin proliferation. In addition, EMILIN1 is identified as a novel ligand for keratinocyte α9β1 integrin, suggesting prospective roles for this receptor-ligand pair in skin homeostasis.


Figures

Figure 1.
Figure 1.
EMILIN1 is expressed by dermal fibroblasts and takes contact with basal keratinocytes. (A) Representative immunofluorescence images of skin cryostat sections of 7-wk-old WT mice stained for EMILIN1 and nuclei. Bar, 50 µm. (B) Zoomed images of boxes in A Arrowheads evidence EMILIN1-positive fibrillar projections that take contact with basal keratinocytes. Bar, 16 µm. (A and B) d, dermis; e, epidermis. The dashed lines denote the BM. (C) Images representing HFs surrounded by EMILIN1. (b) A zoomed image corresponding to the boxed area in a; (c) A transversally cut section where EMILIN1-positive protrusions reach keratinocytes (indicated by arrows); (d, e, and f) Sections cut longitudinally stained for nidogen; (f) A zoomed image corresponding to the boxed area in e, with arrows indicating the EMILIN1-positive protrusions. The white dotted lines in d indicate the sebaceous gland (SG) and bulb. Bars: (a, c, d, and e) 50 µm; (b) 40 µm; (f) 30 µm. (D) Comparative RT-PCR analysis of EMILIN1 mRNA levels in HFs, keratinocytes (K), and fibroblasts (Fb) isolated from newborn WT mouse skin.
Figure 2.
Figure 2.
Skin hyperplastic phenotype in Emilin1−/− mice. (A and B) H/E-stained skin cryostat sections cut longitudinally at different phases of the hair cycle. (A) Low magnification of first anagen (P5) and first catagen (P17). Bars, 200 µm. (B) High magnification of first anagen, late anagen (P10), first catagen, and first telogen (P20). Bars, 50 µm. (C) Cross sections of 7-wk-old skin. Bars, 100 µm. (D and E) ImageJ quantification of epidermis and dermis thickness of 7-wk-old WT (n = 5) and Emilin1−/− (n = 5) mice. For this analysis, three H/E-stained sections for each mouse were examined. Mean values ± SD are reported. *, P = 1 × 10⁻¹⁴; **, P = 2 × 10⁻¹².
Figure 3.
Figure 3.
Emilin1−/− mice display epidermal and dermal hyperproliferation. (A and B) Representative images of WT and Emilin1−/− mouse skin cryostat sections stained for EMILIN1 and for the proliferation marker Ki67. Bars, 75 µm. (Ay and By) yz sections of the confocal images shown in A and B. (A′ and B′) Zoomed images of the boxed areas in A and B. d, dermis; e, epidermis. The dashed lines denote the BM. (C and D) ImageJ analysis of the number of epidermal Ki67-positive cells/micrometer and dermal Ki67-positive cells/100 µm2. Mean values ± SD are reported. *, P < 0.02. For these quantitative analyses, three different cryostat sections of 7-wk-old WT (n = 5) and Emilin1−/− (n = 5) mice were examined. (E) Representative images of WT and Emilin1−/− mouse skin cryostat sections. Green staining represents Keratin 1 (K1), Keratin 5 (K5), Keratin 6 (K6), and loricrin. Nuclei are shown in blue. Bars, 25 µm.
Figure 4.
Figure 4.
EMILIN1 directly affects proliferation of mouse dermal fibroblasts and keratinocytes. (A) In vitro proliferation of mouse dermal fibroblasts. Different populations of WT (n = 4) and of Emilin1−/− (n = 6) fibroblasts at passage 3 were analyzed. The percentage of mean values (±SD) of the number of BrdU-positive cells/field is reported. *, P = 0.01. (B and C) Cocultures of keratinocytes (K) and dermal fibroblasts (Fb) isolated from WT and Emilin1−/− newborn mice. The two cell types (Fb and K) were cultured in the same well (contact) or in a transwell system for 3 d. The quantification of keratinocyte proliferation was performed counting the BrdU and CK double positive cells/field. Here, the percentage of mean values (±SD) of three independent experiments is reported. *, P = 0.03. (D, top) EMILIN1 immunofluorescence staining of mouse fibroblasts transfected with an shRNA Emilin1 (shEmilin1) scrambled sequence (control [ctrl]) and two clones (6505 and 6502) transfected with specific sequences for Emilin1 silencing. (bottom) Contact cocultures of mouse keratinocytes and NIH 3T3 fibroblasts (control and EMILIN1-silenced cells). BrdU-positive cells are stained green; the pan-CK–positive keratinocytes are shown in red. (E) Quantification of BrdU-positive keratinocytes per field. The percentage of mean values (±SD) of three independent experiments is reported. *, P = 0.01; **, P < 0.001. (F) Mouse keratinocytes grown for 48 h on gC1q or fibronectin-coated plates for BrdU and CK. (G) Quantification of BrdU-positive keratinocytes per field. The percentage of mean values (±SD) of three independent experiments is reported. *, P = 0.01. Bars, 50 µm.
Figure 5.
Figure 5.
The EMILIN1 gC1q domain inhibits cell proliferation through the interaction with the α4 and α9 integrin subunit. (A) Proliferation of sarcoma (HT1080 and RD), carcinoma (HeLa and CaCo-2), and immortal keratinocyte (HaCaT) cell lines in the presence or in the absence of 50 µg/ml of soluble gC1q added to the culture medium for 24 h. The percentage of mean values (±SD) of the number of BrdU-positive cells per field of three independent experiments is reported. *, P < 0.05. (B) FACS analysis of α4 and α9 integrin subunit expression levels in HT1080, RD, CaCo-2, HeLa, and HaCaT cells. (C) Cell adhesion of HT1080 and CaCo-2 cells to gC1q. The cells were preincubated with anti–α4 integrin subunit mAb (P1H4), anti–α9 integrin subunit mAb (Y9A2), or anti–β integrin subunit mAb (4B4; final concentration, 10 µg/ml) for 15 min at 37°C and were then allowed to adhere at 37°C for 20 min. Data are expressed as the means ± SD of three independent experiments with six replicates. *, P < 0.05; **, P < 0.001. (D–F) Proliferation inhibition of HT1080, CaCo-2, and HaCaT cells expressed as the percentage versus the respective control (ctrl). The gC1q domain was used at a concentration of 5 µg/ml; the monoclonal antibody anti-gC1q (1H2) and the function blocking monoclonal antibodies anti–α4 integrin subunit (P1H4) and anti–α9 integrin subunit (Y9A2) were used at 10 µg/ml. Data are expressed as the means ± SD of three independent experiments. *, P < 0.05; **, P < 0.001. (G) Effect of gC1q and the mutants E933A, G945A, and the deleted form on CaCo-2 cell proliferation monitored using the XCELLigence system. The cell index after 48 h of dynamic monitoring calculated as the mean ± SD from n = 3 experiments with n = 6 replicates is reported. *, P < 0.001. (H) Representative immunofluorescence images of skin cryostat sections of 7-wk-old WT mice stained for EMILIN1 and for the α9 integrin subunit. Bars, 25 µm.
Figure 6.
Figure 6.
Lack of EMILIN1 up-regulates PI3K/Akt and Erk1/2 and down-regulates PTEN. (A) Representative Western blot analysis of 6–8-wk-old skin tissue extracts of WT and Emilin1−/− mice. (B) Quantification of Western blot analysis reported in A by Quantity One software. The mean values (±SEM) of pSmad2 (Ser465/467 and Ser245/250/255), pErk1/2, PTEN, pAkt (Ser473), PI3K, Cyclin A, and Cdk2 relative expression levels of WT (n = 8) and Emilin1−/− (n = 8) mice are reported. (C) Representative Western blot analysis of epidermis and dermis extracts of 7-wk-old WT and Emilin1−/− mice. (A and C) Molecular mass is indicated in kilodaltons. (D) Quantification of Western blot analysis reported in C by Quantity One software. The mean values (±SD) of pSmad2 (Ser465/467 and Ser245/250/255), pErk1/2, PTEN, pAkt (Ser473), and PI3K relative expression levels of WT (n = 4) and Emilin1−/− (n = 4) mice are reported. *, P = 0.05; **, P < 0.05; ***, P < 0.01.
Figure 7.
Figure 7.
PTEN down-regulates pErk1/2. (A and B) Western blot analysis of dermal fibroblast and keratinocyte extracts after adhesion on control polylysine (Polylys) or on gC1q in the presence or absence of 10 ng/ml TGF-β. (C and D) Western blot analysis of CaCo-2 and HaCaT cell extracts after adhesion on control polylysine or on gC1q in the presence or absence of 10 ng/ml TGF-β. (E and F) Western blot analysis of control (pLKO) or PTEN-silenced (pLKO#49) CaCo-2 and HaCaT cell extracts after adhesion for different lengths of time on gC1q in the presence or absence of 10 ng/ml TGF-β. (G and H) Western blot analysis of control (pLKO) or PTEN-silenced (pLKO#49) CaCo-2 and HaCaT cell extracts after the addition of 5 µg/ml soluble gC1q in the presence or absence of 10 ng/ml TGF-β.
Figure 8.
Figure 8.
Wound closure is accelerated in Emilin1−/− mice. (A) Representative examples at 0, 3, and 7 d after skin wounding. Bars, 2 mm. (B) Quantification of wound closure at 3 and 7 d. The mean values ± SEM are reported. n = 6. *, P = 0.04. (C) Immunofluorescence staining of skin cryostat sections at day 3 with Ki67. Bars, 300 µm. (A and C) The dashed lines indicate the wound edges. (D) Quantification of proliferation in the wounded area. The mean values ± SEM correspond to ImageJ software evaluation of Ki67 fluorescence staining in the wounded area (pixel/area). n = 6. **, P = 0.002.
Figure 9.
Figure 9.
Proposed model for the regulatory role of EMILIN1 in skin homeostasis. The illustration summarizes the proposed molecular mechanism underlying the regulatory role of EMILIN1 in skin proliferation. (A) TGF-β triggers cytostatic signal pathways mainly through pSmad2 (Ser465/467) activation and modulates PI3K/Akt signaling by regulating PTEN expression. Zacchigna et al. (2006) showed that EMILIN1 inhibits TGF-β processing by binding specifically to the pro–TGF-β precursor and by preventing its maturation in the extracellular space. Here, we demonstrated that EMILIN1 binding to dermal fibroblast and basal keratinocytes α4β1/α9β1 integrins empowers the down-regulation of proliferative cues induced by TGF-β. This effect is mediated by α4/α9β1-dependent PTEN activation and inhibition of pErk1/2 proproliferative activity. (B) The increased levels of mature TGF-β and the lack of α4/α9β1 integrin–specific engagement by the lack of EMILIN1 result in PTEN down-regulation and, hence, reduced activity. This determines the activation of proliferative pathways such as pAkt and pErk1/2 that in turn lead to a reduction of TGF-β signaling via increased Erk1/2-dependent phosphorylation of Smad2 at inhibitory Ser245/250/255. In conclusion, we provide the first evidence for the central role of PTEN in the cross talk between α4/α9β1 integrin and TGF-β signal pathways.

References

    1. Annes J.P., Munger J.S., Rifkin D.B. 2003. Making sense of latent TGFbeta activation. J. Cell Sci. 116:217–224 10.1242/jcs.00229 - DOI - PubMed
    1. Beck S., Le Good J.A., Guzman M., Ben Haim N., Roy K., Beermann F., Constam D.B. 2002. Extraembryonic proteases regulate Nodal signalling during gastrulation. Nat. Cell Biol. 4:981–985 10.1038/ncb890 - DOI - PubMed
    1. Blanpain C., Fuchs E. 2009. Epidermal homeostasis: a balancing act of stem cells in the skin. Nat. Rev. Mol. Cell Biol. 10:207–217 10.1038/nrm2636 - DOI - PMC - PubMed
    1. Böck P. 1983. Elastic fiber microfibrils: filaments that anchor the epithelium of the epiglottis. Arch. Histol. Jpn. 46:307–314 10.1679/aohc.46.307 - DOI - PubMed
    1. Böttinger E.P., Jakubczak J.L., Roberts I.S., Mumy M., Hemmati P., Bagnall K., Merlino G., Wakefield L.M. 1997. Expression of a dominant-negative mutant TGF-beta type II receptor in transgenic mice reveals essential roles for TGF-beta in regulation of growth and differentiation in the exocrine pancreas. EMBO J. 16:2621–2633 10.1093/emboj/16.10.2621 - DOI - PMC - PubMed

Publication types

MeSH terms