. 2011 Sep;9(9):e1001155.
doi: 10.1371/journal.pbio.1001155. Epub 2011 Sep 20.

Transcriptome analysis of the Arabidopsis megaspore mother cell uncovers the importance of RNA helicases for plant germline development

Affiliations

Transcriptome analysis of the Arabidopsis megaspore mother cell uncovers the importance of RNA helicases for plant germline development

Anja Schmidt et al. PLoS Biol. 2011 Sep.

Abstract

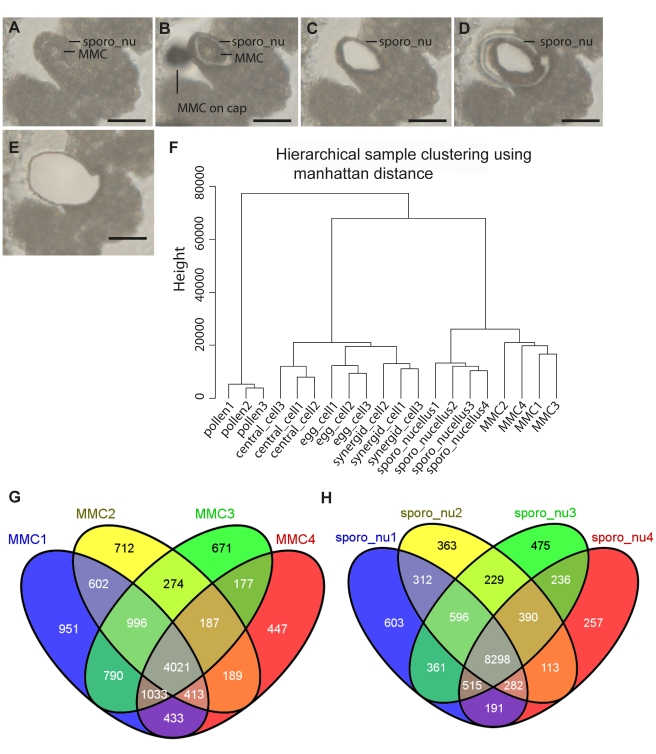
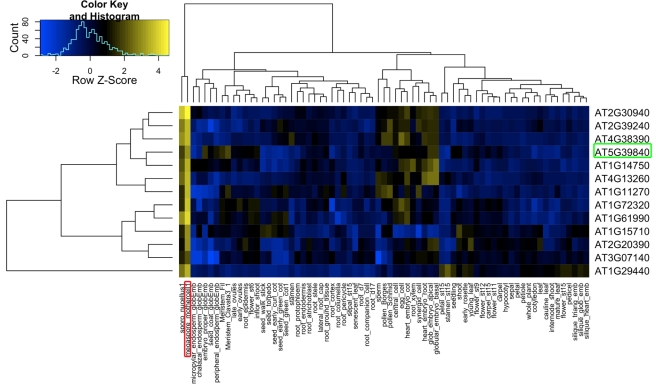
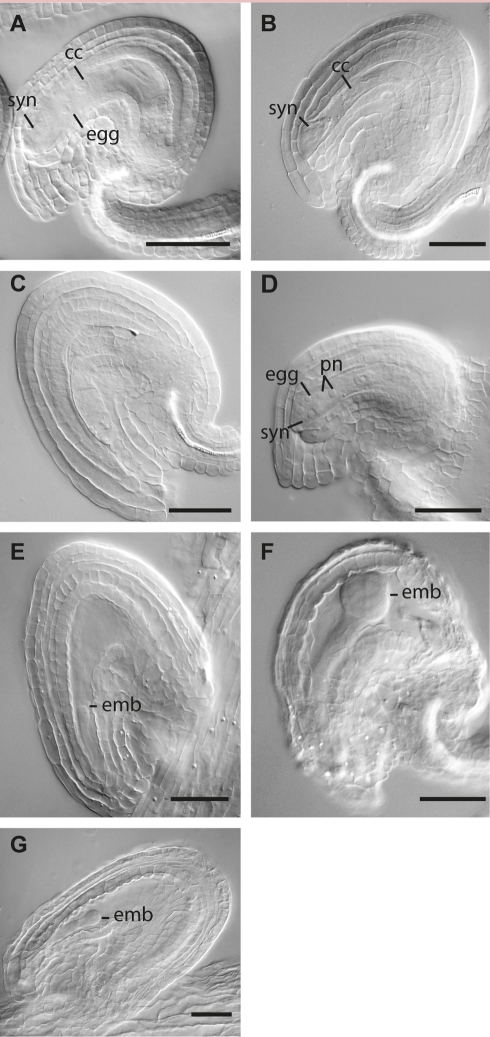
Germ line specification is a crucial step in the life cycle of all organisms. For sexual plant reproduction, the megaspore mother cell (MMC) is of crucial importance: it marks the first cell of the plant "germline" lineage that gets committed to undergo meiosis. One of the meiotic products, the functional megaspore, subsequently gives rise to the haploid, multicellular female gametophyte that harbours the female gametes. The MMC is formed by selection and differentiation of a single somatic, sub-epidermal cell in the ovule. The transcriptional network underlying MMC specification and differentiation is largely unknown. We provide the first transcriptome analysis of an MMC using the model plant Arabidopsis thaliana with a combination of laser-assisted microdissection and microarray hybridizations. Statistical analyses identified an over-representation of translational regulation control pathways and a significant enrichment of DEAD/DEAH-box helicases in the MMC transcriptome, paralleling important features of the animal germline. Analysis of two independent T-DNA insertion lines suggests an important role of an enriched helicase, MNEME (MEM), in MMC differentiation and the restriction of the germline fate to only one cell per ovule primordium. In heterozygous mem mutants, additional enlarged MMC-like cells, which sometimes initiate female gametophyte development, were observed at higher frequencies than in the wild type. This closely resembles the phenotype of mutants affected in the small RNA and DNA-methylation pathways important for epigenetic regulation. Importantly, the mem phenotype shows features of apospory, as female gametophytes initiate from two non-sister cells in these mutants. Moreover, in mem gametophytic nuclei, both higher order chromatin structure and the distribution of LIKE HETEROCHROMATIN PROTEIN1 were affected, indicating epigenetic perturbations. In summary, the MMC transcriptome sets the stage for future functional characterization as illustrated by the identification of MEM, a novel gene involved in the restriction of germline fate.


Conflict of interest statement

The authors have declared that no competing interests exist.

Figures

Figure 1
Figure 1. Laser-assisted microdissection (LAM) and transcriptome analysis to study megasporogenesis.
(A–E) LAM of the megaspore mother cell (MMC) and the surrounding sporophytic nucellus tissue from a 6 µm dry section (scale bars 20 µm). (A) An ovule harboring the MMC before LAM. (B) The MMC was dissected from the surrounding tissue by applying the ultraviolet laser beam (diameter of ∼1 µm). Next to the nucellus is the shade of an MMC previously dissected on the surface of the isolation cap. (C) The ovule from which the MMC has been removed using an MMI isolation cap. (D–E) The surrounding sporophytic nucellus (sporo_nu) was dissected from the remaining ovule tissue (D) and removed with a separate MMI isolation cap (E). (F) Hierarchical sample clustering (manhattan distance) of female gametophytic cell types and pollen (pollen_Schmid as included in the tissue atlas [22]). Biological replicates cluster together, showing high reproducibility of the data. Samples from MMC (megaspore_mothercell) and the surrounding nucellus tissue (sporo_nucellus, sporo_nu) form a close cluster when compared to the mature female and male gametophyte, indicating their close relationship in terms of cell lineage. (G–H) Venn diagrams showing the overlaps of predictions of gene expression (present calls) as determined with the AtPANP algorithm.
Figure 2
Figure 2. Independent data validation.
Data validation for genes preferentially expressed in the MMC (A–L) or expressed in the nucellus tissues (M–N). Scale bars are 20 µm, arrows point towards the MMC, ii (inner integuments), nuc (nucellus). (A–F) In situ hybridizations with antisense probes for AT3G14700, encoding a SART-1 family protein (A) AT2G30940, a gene encoding a protein kinase (B), the transcription factor gene AT1G31150 (C), AT2G29210 coding for a splicing factor PWI domain-containing protein (D), PUMILIO23 (PUM23, AT1G72320) (E), and AT5G23080 encoding TOUGH (TGH), which interacts with TATA-box binding protein 2 (F). (G–J) GUS staining of plant lines expressing translational fusions of the putative promoter regions of AT1G11270 encoding an F-box and associated interaction domains containing protein (G), AT3G19510 encoding HAT3.1 that belongs to the family of PHD-finger homeodomain proteins (I), AT3G21175 encoding GATA transcription factor 24 (H), and AT2G24500 coding for the C2H2 zinc finger protein FZF (J) with the E. coli uidA gene. (K, L) GUS staining of ET4022 and ET7943 with the enhancer trap element inserted in the genomic regions of AT1G31240 and AT1G80440, encoding a bromodomain transcription factor and a galactose oxidase/kelch repeat superfamily protein, respectively. (M) GUS staining with a line expressing the E. coli uidA gene under control of the PUM12 promoter . (N) GFP signal observed in lines carrying the pABCB19:ABCB19-GFP construct reporting expression of an ATP-binding cassette (ABC) transporter .
Figure 3
Figure 3. Heatmap of expression values for genes differentially expressed in MMCs and the mature female gametophyte.
Heatmap of log2-scale expression values for genes significantly differentially expressed in MMC (megaspore_mothercell) and the cells of the mature female gametophyte (egg cell, central cell, synergids). Hierarchical clustering of genes/samples was based on euclidean distance and hierarchical agglomerative clustering. Colors are scaled per row and yellow denotes high expression and blue low expression.
Figure 4
Figure 4. Heatmap of expression values for genes enriched in MMCs as compared to the tissue atlas.
Heatmap of log2-transformed mean expression values showing 13 genes significantly enriched in the MMC samples as compared to the tissue atlas composed of a total of 72 from different Arabidopsis cell types and tissues (p value <0.01 after Benjamini-Hochberg adjustment). Hierarchical clustering of genes/samples was based on euclidean distance and hierarchical agglomerative clustering. Colors are scaled per row and yellow denotes high expression and blue low expression. Red box, MMC; green box, MEM.
Figure 5
Figure 5. Analysis of MEM expression and mem-1 and mem-2 mutant phenotypes during megasporogenesis.
(A–C) In situ hybridization showing expression of MEM in the MMC (A), the degenerating tetrad (B), and the functional megaspore (B, C) in wild-type plants using an antisense probe targeting MEM. (D–I) Differentiation of MMCs in ovules of heterozygous mem-1/MEM (D, H, I) and mem-2/MEM (E, F, G) mutant plants. In developing ovules, either one normally differentiated MMC (D), two MMCs (E, H), or an MMC with one or more smaller unusual adjacent cells were observed (F, G, I). (J–M) Two gametophytic cells with FMS characteristics were often observed at the FMS stage (J, K) or after the first mitotic division (M), or abnormal cells were seen adjacent to the degenerated megaspores (L) in ovules of mem-1/MEM (J) and mem-2/MEM (K–M) mutant plants. (N, O) Analysis of H2B-YFP expression under the control of the AKV promoter in plants heterozygous for the mem-2 allele. YFP signals were studied by confocal microscopy. The AKV cell identity marker indicates one gametophytic cell in the wild-type ovule (N) and two gametopyhtic cells in the mutant ovule (O) at the FMS developmental stage. Scale bars are 20 µm (A–C, N, O) and 10 µm (D–M) (arrows point to MMC, an arrow with an asterisk indicates abnormal adjacent cell, two asterisks denote degenerated megaspores, ii inner integuments; nuc, nucellus; N, nucleus).
Figure 6
Figure 6. Phenotypic analysis of mem-1 and mem-2 mature gametophytes and early embryogenesis.
(A) Wild-type embryo sac. (B–D) Typical phenotypes observed in mature female gametophytes of plants heterozygous for mem-1. Abnormally narrow shaped embryo sacs (B), ovules with differentiated sporophyte but without discernible gametophyte (C), and gametophytes with unfused polar nuclei (pn) were observed (D). (E–G) Arrest of embryonic development in mutants heterozygous for mem-1 (E, F) or mem-2. (F) Embryo developmental arrest was typically observed latest at globular stage. (A–G) Scale bars are 40 µm; egg, egg cell; syn, synergids; cc, central cell; emb, embryo; pn, polar nuclei.
Figure 7
Figure 7. Studies of changes in the epigenetic landscape in mem-1 and mem-2 mutant gametophytic nuclei.
(A–F) GFP and YFP signals were studied by confocal microscopy. Scale bars are 20 µm. Arrows point to nuclei. (A–C, G) Analysis of TFL2-GFP expression under the control of the TFL2 promoter in mem heterozygous plants. Fluorescence of the GFP marker protein was observed in nuclei of central cell (CCN), egg cell (EN), and synergids (SYN), indicating binding of the TFL2-GFP fusion protein to H3K27me3 methylation marks (A). No GFP signals were observed in mutant mature gametophytes with two unfused polar nuclei (PN) in mem-1 (B, G) and mem-2 mutants (C, G) and rarely in ovules with other mutant phenotypes (G). (D–F) Analysis of H2B-YFP expression under the control of the AKV promoter in plants heterozygous for the mem-1 (D, E) and mem-2 allele (F). The AKV cell identity marker expressed in developing gametophytes indicates a more condensed heterochromatin structure in some nuclei of mutant gametophytes (arrows point to nuclei; insets: signal distribution in wild-type (D) and mutant nuclei (E, F)). (G) Percentages of mutant phenotypes and presence (+) or absence (−) of GFP signal due to the TFL2-GFP marker observed in a total of N = 111 and N = 87 mature embryo sacs analyzed from mem-1/MEM and mem-2/MEM plants, respectively. GFP signal was only occasionally observed in mutant ovules. If embryo sacs could not clearly be classified as mutants or wild-type, they were recorded as “unclear”; if they were clearly mutant but the central cell nuclei/us was/were not visible, they were recorded under “other mutant phenotypes.” The latter class includes 8% of mem-2/MEM ovules without GFP signal that likely had unfused polar nuclei, which were, however, not clearly visible. In contrast, GFP signal was observed in 93% and ≥78% of the wild-type ovules in the mem-1 and mem-2 mutants, respectively.

References

    1. Grossniklaus U. Plant germline development: a tale of cross-talk, signaling, and cellular interactions. Sex Plant Reprod. 2011;24:91–95. - PubMed
    1. Grossniklaus U, Schneitz K. The molecular and genetic basis of ovule and megagametophyte development. Semin Cell Dev Biol. 1998;9:227–238. - PubMed
    1. Koltunow A. M. Apomixis: embryo sacs and embryos formed without meiosis or fertilization in ovules. Plant Cell. 1993;5:1425–1437. - PMC - PubMed
    1. Koltunow A. M, Grossniklaus U. Apomixis: a developmental perspective. Annu Rev Plant Biol. 2003;54:547–574. - PubMed
    1. Drews G. N, Lee D, Christensen C. A. Genetic analysis of female gametophyte development and function. Plant Cell. 1998;10:5–17. - PMC - PubMed

Publication types

MeSH terms