. 2011;6(9):e24092.
doi: 10.1371/journal.pone.0024092. Epub 2011 Sep 16.

Suppression of inflammatory immune responses in celiac disease by experimental hookworm infection

Affiliations

Suppression of inflammatory immune responses in celiac disease by experimental hookworm infection

Henry J McSorley et al. PLoS One. 2011.

Abstract

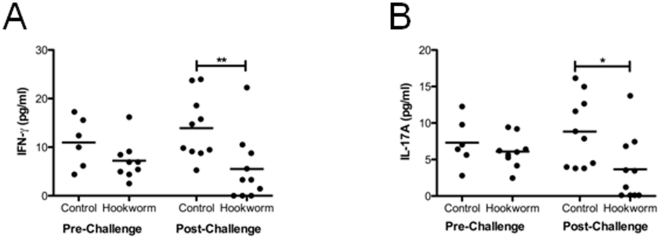
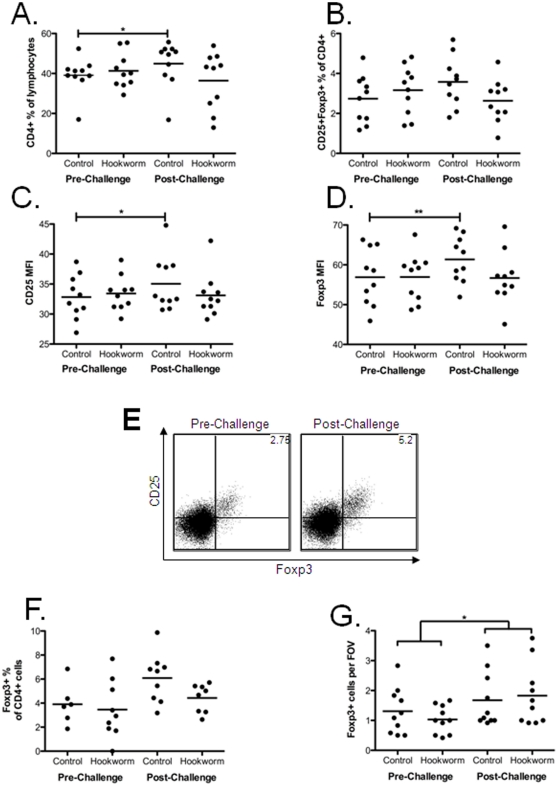
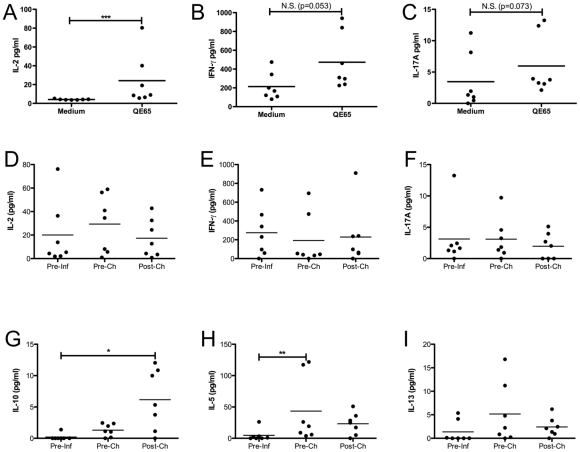
We present immunological data from two clinical trials where the effect of experimental human hookworm (Necator americanus) infection on the pathology of celiac disease was evaluated. We found that basal production of Interferon- (IFN-)γ and Interleukin- (IL-)17A from duodenal biopsy culture was suppressed in hookworm-infected participants compared to uninfected controls. Increased levels of CD4+CD25+Foxp3+ cells in the circulation and mucosa are associated with active celiac disease. We show that this accumulation also occurs during a short-term (1 week) oral gluten challenge, and that hookworm infection suppressed the increase of circulating CD4+CD25+Foxp3+ cells during this challenge period. When duodenal biopsies from hookworm-infected participants were restimulated with the immunodominant gliadin peptide QE65, robust production of IL-2, IFN-γ and IL-17A was detected, even prior to gluten challenge while participants were strictly adhering to a gluten-free diet. Intriguingly, IL-5 was produced only after hookworm infection in response to QE65. Thus we hypothesise that hookworm-induced TH2 and IL-10 cross-regulation of the TH1/TH17 inflammatory response may be responsible for the suppression of these responses during experimental hookworm infection.


Conflict of interest statement

Competing Interests: The authors have declared that no competing interests exist.

Figures

Figure 1
Figure 1. Biopsies taken pre-challenge (week 20) and post-challenge (week 21) from trial 1 and were cultured for 24 hours in tissue culture medium, then supernatants taken for CBA analysis of IFN-γ (A) and IL-17A (B).
One-way ANOVA was carried out comparing between groups and timepoints. Unless otherwise indicated differences are not significant. ** = p<0.01, * = p<0.05.
Figure 2
Figure 2. PBMCs from trial 1 pre-challenge (week 20) and post-challenge (week 21) were prepared, cryopreserved and thawed together, then stained for CD4, Foxp3 and CD25.
Proportions of CD4+ cells in the PBMC lymphocyte population (A). Proportions of CD25+Foxp3+ cells in CD4+ population (B). CD25 MFI (C) and Foxp3 MFI (D), both in the CD4+CD25+Foxp3+ population. Representative Foxp3 versus CD25 plots of cells gated on CD4+ PBMCs are shown in (E). Cell suspensions were prepared from duodenal biopsies pre-challenge and post-challenge, and stained for CD4 and Foxp3. Foxp3+ proportion of the CD4+ population of biopsy cells (F). Formalin fixed duodenal biopsies were also stained for Foxp3 by immunohistochemistry, Foxp3+ cells per high-power field of view (G). Where paired data was available (all except (F)), data were analysed by two-way ANOVA, and if a significant interaction was found paired t tests were used to show differences within groups. For (F), data were analysed by non-parametric ANOVA. N.S. = not significant, * = p<0.05, ** = p<0.01.
Figure 3
Figure 3. Duodenal biopsies were taken from trial 2 participants pre-infection (Pre-Inf, week 0), pre-challenge (Pre-Ch, week 20) and post-challenge (Post-Ch, week 21) and cultured in either medium alone or with 50 µg/ml QE65 peptide for 24 hours at 37°C in 95% O2/5% CO2.
Supernatants were then taken and levels of cytokines measured by CBA. Results shown in A–C are from the pre-infection timepoint only, showing both medium and QE65 levels. All other results (D–I) have had medium controls subtracted. Cytokines shown are IL-2 (A, D), IFN-γ (B, E), IL-17A (C, F), IL-10 (G), IL-5 (H) and IL-13 (I). A–C was analysed by paired t tests, D–I by 1-way ANOVA. Where data was not normally distributed, log-transformation was carried out and parametric tests used. Differences are not significant unless indicated. * = p<0.05, ** = p<0.01.

References

    1. Green PH, Cellier C. Celiac disease. N Engl J Med. 2007;357:1731–1743. - PubMed
    1. Guandalini S, Setty M. Celiac disease. Curr Opin Gastroenterol. 2008;24:707–712. - PubMed
    1. Meresse B, Ripoche J, Heyman M, Cerf-Bensussan N. Celiac disease: from oral tolerance to intestinal inflammation, autoimmunity and lymphomagenesis. Mucosal Immunol. 2009;2:8–23. - PubMed
    1. Tjon JM, van Bergen J, Koning F. Celiac disease: how complicated can it get? Immunogenetics 2010 - PMC - PubMed
    1. Castellanos-Rubio A, Santin I, Irastorza I, Castano L, Carlos Vitoria J, et al. TH17 (and TH1) signatures of intestinal biopsies of CD patients in response to gliadin. Autoimmunity. 2009;42:69–73. - PubMed

Publication types

MeSH terms