

Early embryonic vascular patterning by matrix-mediated paracrine signalling: a mathematical model study
- PMID: 21949696
- PMCID: PMC3176223
- DOI: 10.1371/journal.pone.0024175
Early embryonic vascular patterning by matrix-mediated paracrine signalling: a mathematical model study
Abstract
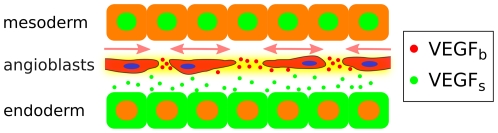
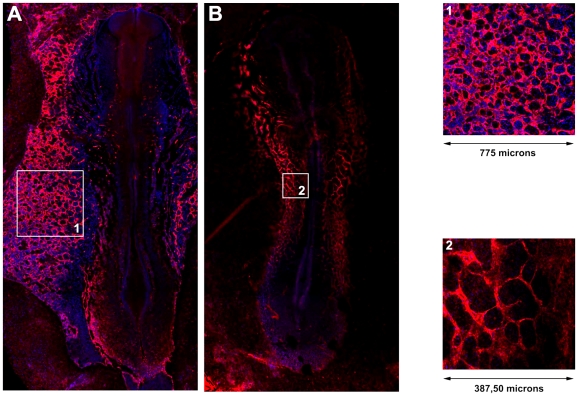
During embryonic vasculogenesis, endothelial precursor cells of mesodermal origin known as angioblasts assemble into a characteristic network pattern. Although a considerable amount of markers and signals involved in this process have been identified, the mechanisms underlying the coalescence of angioblasts into this reticular pattern remain unclear. Various recent studies hypothesize that autocrine regulation of the chemoattractant vascular endothelial growth factor (VEGF) is responsible for the formation of vascular networks in vitro. However, the autocrine regulation hypothesis does not fit well with reported data on in vivo early vascular development. In this study, we propose a mathematical model based on the alternative assumption that endodermal VEGF signalling activity, having a paracrine effect on adjacent angioblasts, is mediated by its binding to the extracellular matrix (ECM). Detailed morphometric analysis of simulated networks and images obtained from in vivo quail embryos reveals the model mimics the vascular patterns with high accuracy. These results show that paracrine signalling can result in the formation of fine-grained cellular networks when mediated by angioblast-produced ECM. This lends additional support to the theory that patterning during early vascular development in the vertebrate embryo is regulated by paracrine signalling.
Conflict of interest statement
Figures
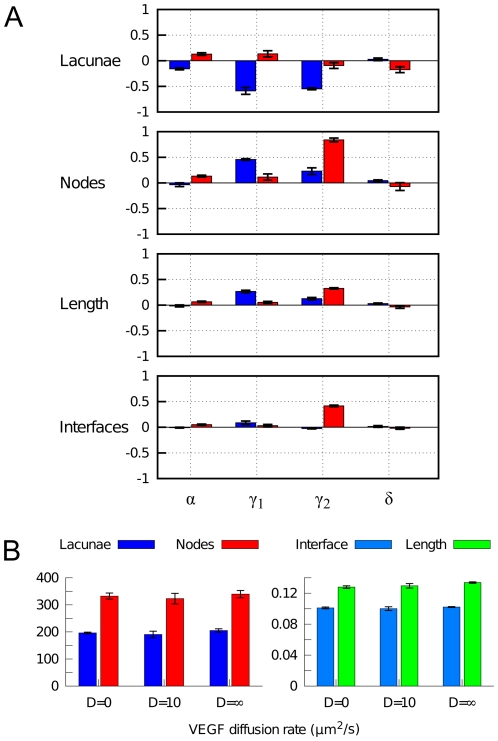
 , VEGF and ECM production (
 and
and  ), and degradation of soluble VEGF (
 ). Changes in various morphometric properties were measured for simulations (n = 3) in which each parameter was independently varied by a 10-fold decrease (blue) and a 10-fold increase (red). (B) Sensitivity to VEGF diffusivity. Morphometric quantities are shown for simulations (n = 3) with non-diffusive VEGF (
 ), with normal VEGF diffusion (
 ), and with well-mixed VEGF (
 ).
).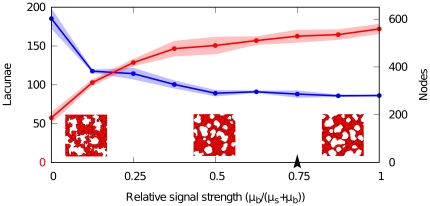
 ) and soluble (
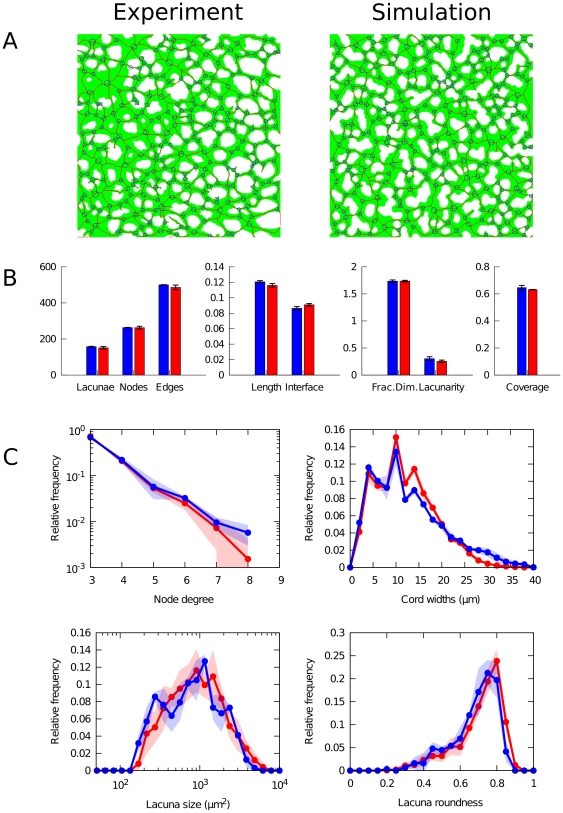
 ) VEGF. Red points (lacunae) and blue points (nodes) show averages of measured quantities in simulations (n = 3), half-transparent regions represent standard deviations. Insets show portions of networks (200×200
 ) where the relative signalling strength (
 ) is set to soluble-VEGF-only (
 , left), bound-VEGF-only (
 , right) and equal strengths (
 , center). Arrowhead indicates the reference value.
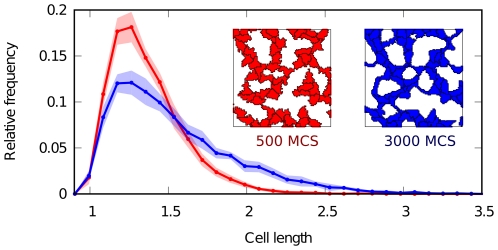
 , where
  is the scaling factor per pixel). Cells become increasingly anisotropic and elongated during vascular patterning. Filled regions represent standard deviation.
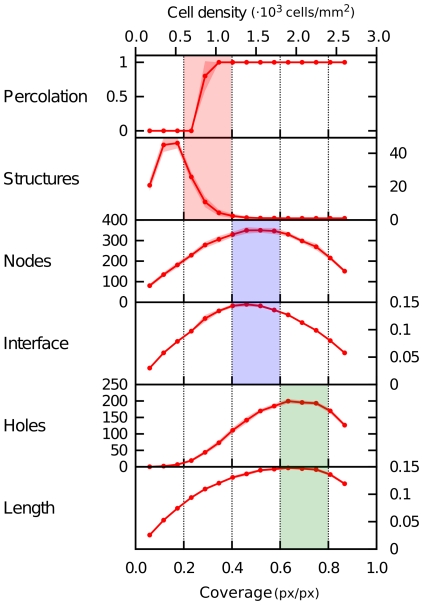
References
-
- Rissau W, Flamme I. Vasculogenesis. Annu Rev Cell Dev Biol. 1995;11:73–91. - PubMed
-
- Cleaver O, Krieg P. Vascular development. In: Rosenthal N, Harvey R, editors. Heart development and regeneration. San Diego: Academic Press; 2010. pp. 487–528.
-
- Drake DJ, Brandt SJ, Trusk TC, Little CD. TAL1/SCL is expressed in endothelial progenitor cells/angioblasts and defines a dorsal-to-ventral gradient of vasculogenesis. Dev Biol. 1997;192:17–30. - PubMed
-
- Ambrosi D, Bussolino F, Preziosi L. A review of vasculogenesis models. J Theor Med. 2005;6:1–19.
-
- Herrero MA, Köhn A, Pérez-Pomares JM. Modelling vascular morphogenesis: Current views on blood vessels development. Math Mod Meth Appl Sci. 2009;19,(Suppl):1483–1537.
Publication types
MeSH terms
Substances
LinkOut - more resources
Full Text Sources
