

IgE recognition patterns of profilin, PR-10, and tropomyosin panallergens tested in 3,113 allergic patients by allergen microarray-based technology
- PMID: 21949785
- PMCID: PMC3174236
- DOI: 10.1371/journal.pone.0024912
IgE recognition patterns of profilin, PR-10, and tropomyosin panallergens tested in 3,113 allergic patients by allergen microarray-based technology
Abstract
Background: IgE recognition of panallergens having highly conserved sequence regions, structure, and function and shared by inhalant and food allergen sources is often observed.
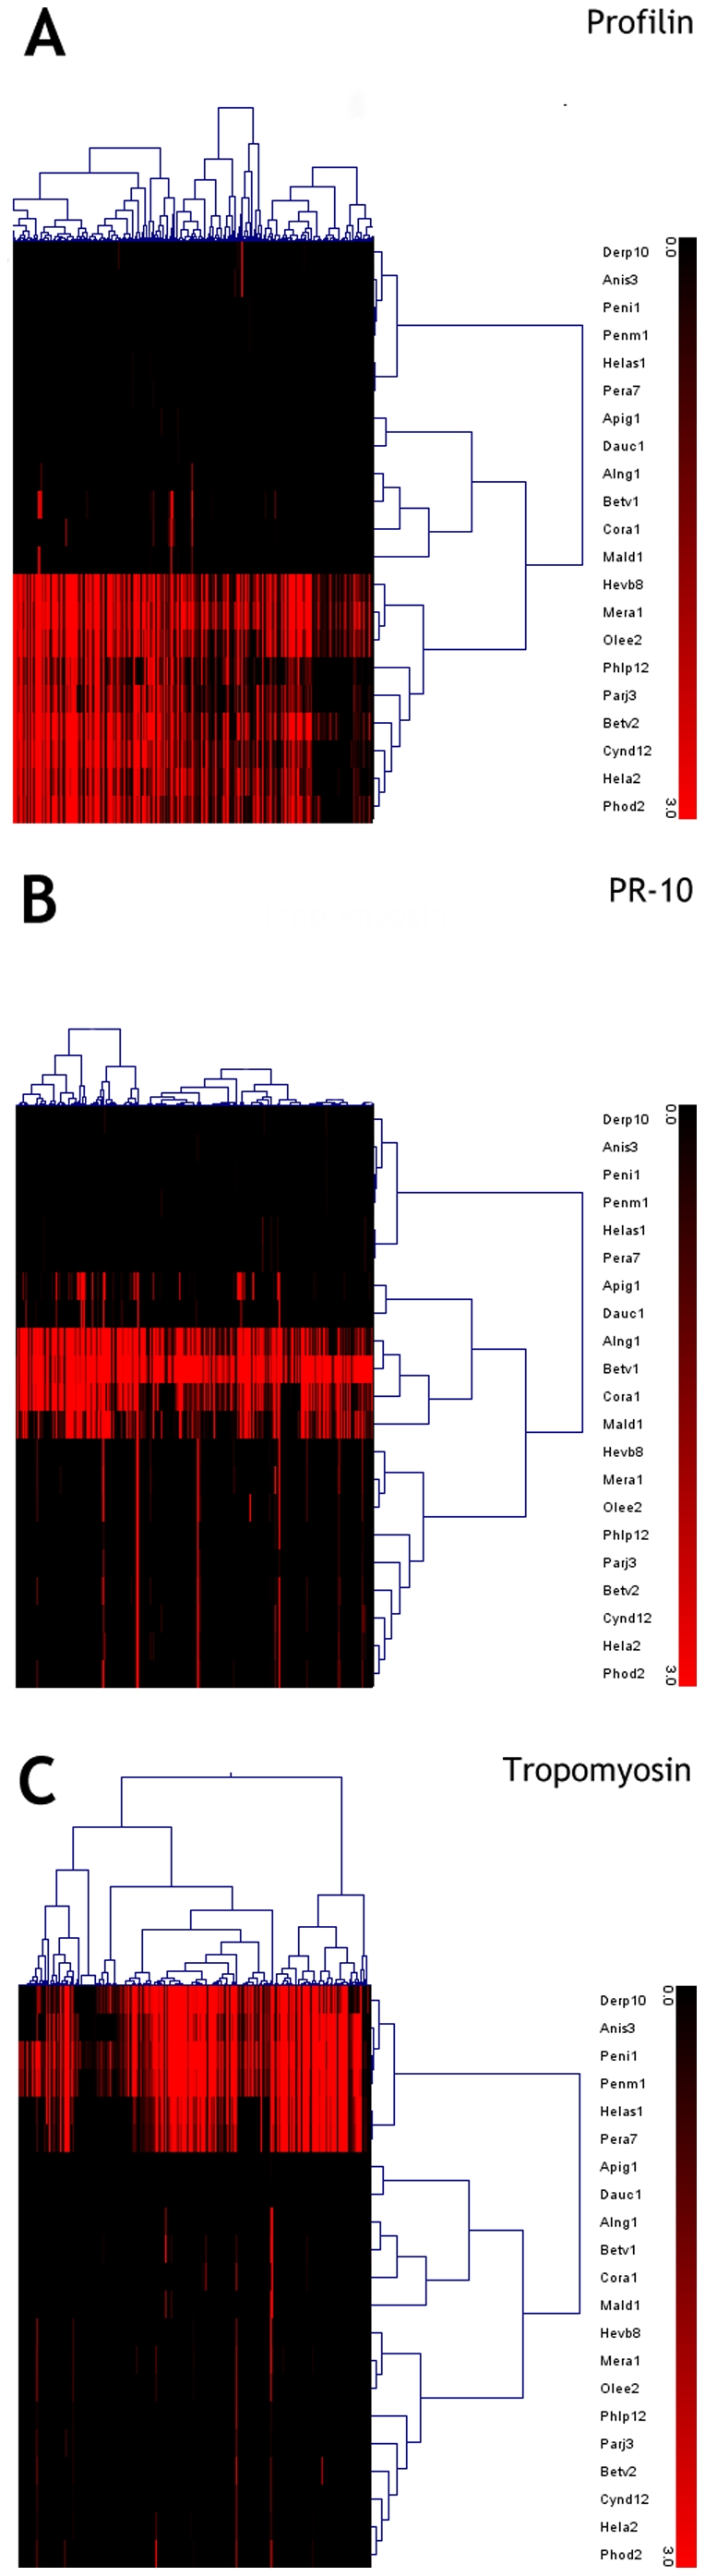
Methods: We evaluated the IgE recognition profile of profilins (Bet v 2, Cyn d 12, Hel a 2, Hev b 8, Mer a 1, Ole e 2, Par j 3, Phl p 12, Pho d 2), PR-10 proteins (Aln g 1, Api g 1, Bet v 1.0101, Bet v 1.0401, Cor a 1, Dau c 1 and Mal d 1.0108) and tropomyosins (Ani s 3, Der p 10, Hel as 1, Pen i 1, Pen m 1, Per a 7) using the Immuno-Solid phase Allergen Chip (ISAC) microarray system. The three panallergen groups were well represented among the allergenic molecules immobilized on the ISAC. Moreover, they are distributed in several taxonomical allergenic sources, either close or distant, and have a route of exposure being either inhalation or ingestion.
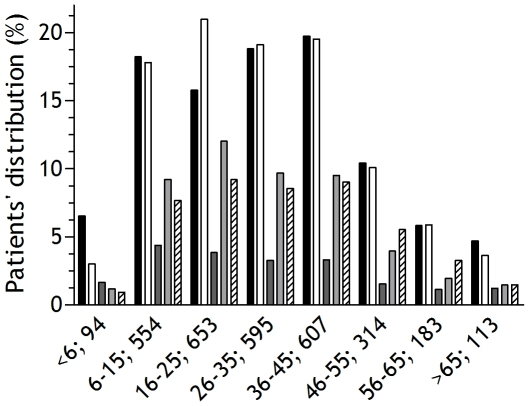
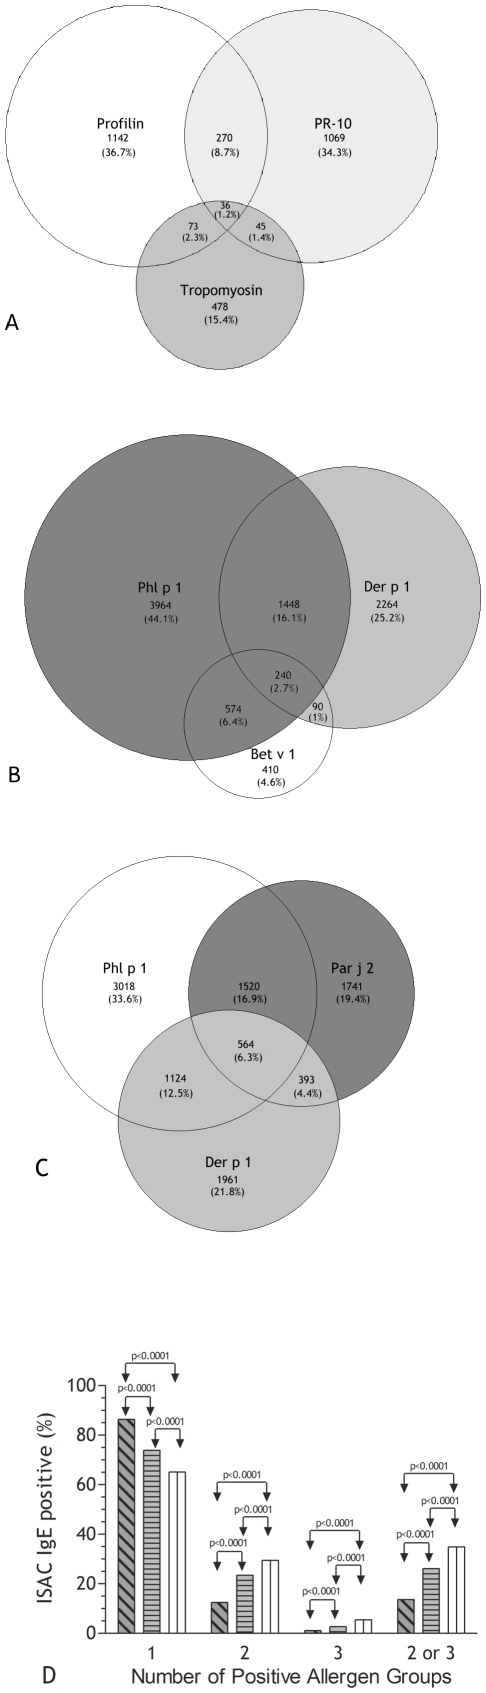
Results: 3,113 individuals (49.9% female) were selected on the basis of their reactivity to profilins, PR-10 or tropomyosins. 1,521 (48.8%) patients were reactive to profilins (77.6% Mer a 1 IgE(+)), 1,420 (45.6%) to PR-10 (92.5% Bet v 1 IgE(+)) and 632 (20.3%) to tropomyosins (68% Der p 10 IgE(+)). A significant direct relationship between different representative molecules within each group of panallergens was found. 2,688 patients (86.4%) recognized only one out of the three distinct groups of molecules as confirmed also by hierarchical clustering analysis.
Conclusions: Unless exposed to most of the allergens in the same or related allergenic sources, a preferential IgE response to distinct panallergens has been recorded. Allergen microarray IgE testing increases our knowledge of the IgE immune response and related epidemiological features within and between homologous molecules better describing the patients' immunological phenotypes.
Conflict of interest statement
Figures

Similar articles
-
Molecular Recognition Profiles and Clinical Patterns of PR-10 Sensitization in a Birch-Free Mediterranean Area.Int Arch Allergy Immunol. 2017;173(3):138-146. doi: 10.1159/000477565. Epub 2017 Aug 9. Int Arch Allergy Immunol. 2017. PMID: 28787736
-
Sensitization to the pollen pan-allergen profilin. Is the detection of immunoglobulin E to multiple homologous proteins from different sources clinically useful?J Investig Allergol Clin Immunol. 2010;20(7):591-5. J Investig Allergol Clin Immunol. 2010. PMID: 21314000
-
Characterization of IgE epitopes of Cuc m 2, the major melon allergen, and their role in cross-reactivity with pollen profilins.Clin Exp Allergy. 2010 Jan;40(1):174-81. doi: 10.1111/j.1365-2222.2009.03401.x. Clin Exp Allergy. 2010. PMID: 20205701
-
[Cross-reactivity between fruit and vegetables].Allergol Immunopathol (Madr). 2003 May-Jun;31(3):141-6. doi: 10.1016/s0301-0546(03)79281-7. Allergol Immunopathol (Madr). 2003. PMID: 12783764 Review. Spanish.
-
How relevant is panallergen sensitization in the development of allergies?Pediatr Allergy Immunol. 2016 Sep;27(6):560-8. doi: 10.1111/pai.12589. Pediatr Allergy Immunol. 2016. PMID: 27129102 Free PMC article. Review.
Cited by
-
IgE allergy diagnostics and other relevant tests in allergy, a World Allergy Organization position paper.World Allergy Organ J. 2020 Feb 25;13(2):100080. doi: 10.1016/j.waojou.2019.100080. eCollection 2020 Feb. World Allergy Organ J. 2020. PMID: 32128023 Free PMC article.
-
Machine learning to identify pairwise interactions between specific IgE antibodies and their association with asthma: A cross-sectional analysis within a population-based birth cohort.PLoS Med. 2018 Nov 13;15(11):e1002691. doi: 10.1371/journal.pmed.1002691. eCollection 2018 Nov. PLoS Med. 2018. PMID: 30422985 Free PMC article.
-
Revisiting Fruit Allergy: Prevalence across the Globe, Diagnosis, and Current Management.Foods. 2023 Nov 10;12(22):4083. doi: 10.3390/foods12224083. Foods. 2023. PMID: 38002141 Free PMC article. Review.
-
Molecular biomarkers for grass pollen immunotherapy.World J Methodol. 2014 Mar 26;4(1):26-45. doi: 10.5662/wjm.v4.i1.26. eCollection 2014 Mar 26. World J Methodol. 2014. PMID: 25237628 Free PMC article. Review.
-
Linking cross-reactivity clusters of food and respiratory allergens in PAMD@ to asthma and duration of allergy.World Allergy Organ J. 2020 Nov 21;13(12):100483. doi: 10.1016/j.waojou.2020.100483. eCollection 2020 Dec. World Allergy Organ J. 2020. PMID: 33294115 Free PMC article.
References
-
- Gupta R, Sheikh A, Strachan DP, Anderson HR. Burden of allergic disease in the UK: secondary analyses of national databases. Clin Exp Allergy. 2004;34:520–6. - PubMed
-
- Valenta R, Twaroch T, Swoboda I. Component-resolved diagnosis to optimize allergen-specific immunotherapy in the Mediterranean area. J Investig Allergol Clin Immunol. 2007;17(Suppl 1):36–40. - PubMed
-
- Grall F, Caroff J, Corson M, Morin JF, Clavier J. Correlations between specific IgE cutaneous tests and the clinical diagnosis of allergies in asthma and respiratory equivalents. Rev Fr Allergol Immunol Clin. 1977;17:7–12.
-
- Mari A. Multiple pollen sensitization: a molecular approach to the diagnosis. Int Arch Allergy Immunol. 2001;125:57–65. - PubMed
Publication types
MeSH terms
Substances
LinkOut - more resources
Full Text Sources
Medical
Research Materials
Miscellaneous
