

Influence of body position on cortical pain-related somatosensory processing: an ERP study
- PMID: 21949794
- PMCID: PMC3174221
- DOI: 10.1371/journal.pone.0024932
Influence of body position on cortical pain-related somatosensory processing: an ERP study
Abstract
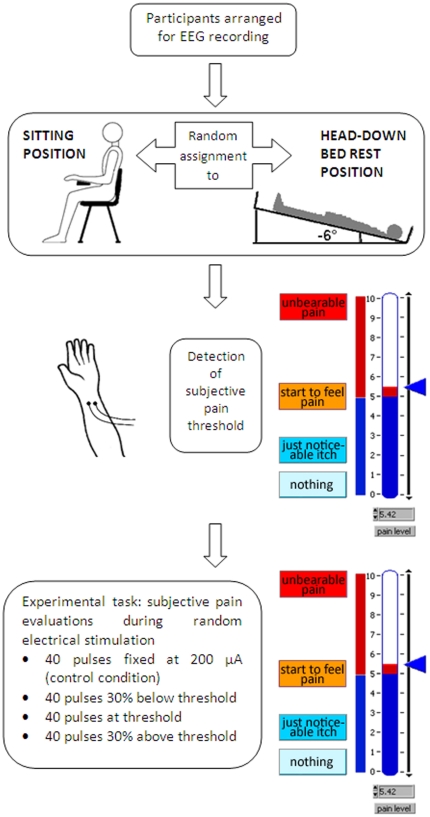
Background: Despite the consistent information available on the physiological changes induced by head down bed rest, a condition which simulates space microgravity, our knowledge on the possible perceptual-cortical alterations is still poor. The present study investigated the effects of 2-h head-down bed rest on subjective and cortical responses elicited by electrical, pain-related somatosensory stimulation.
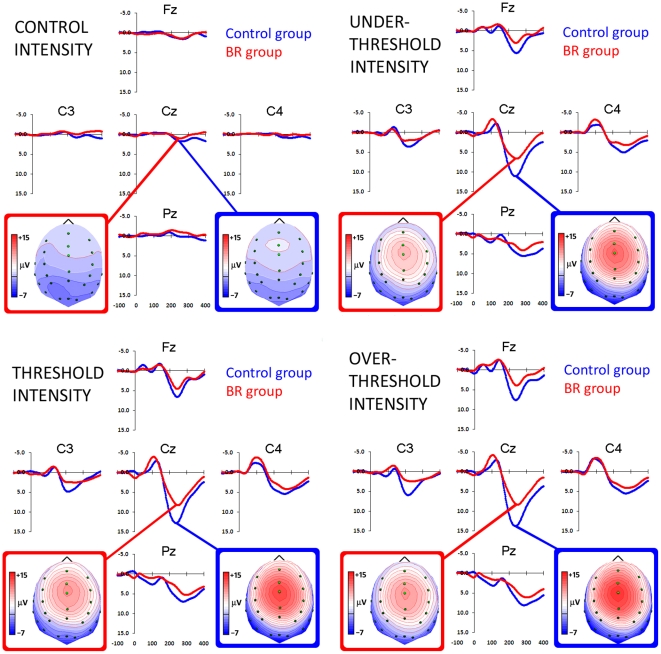
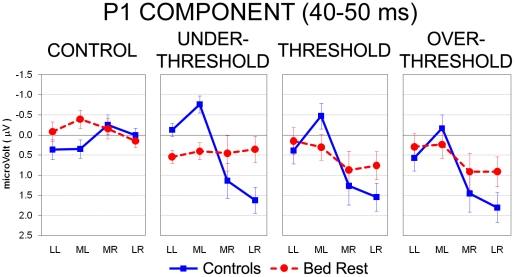
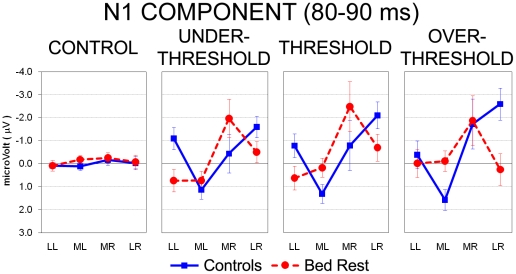
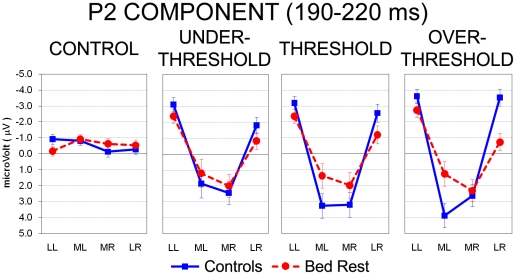
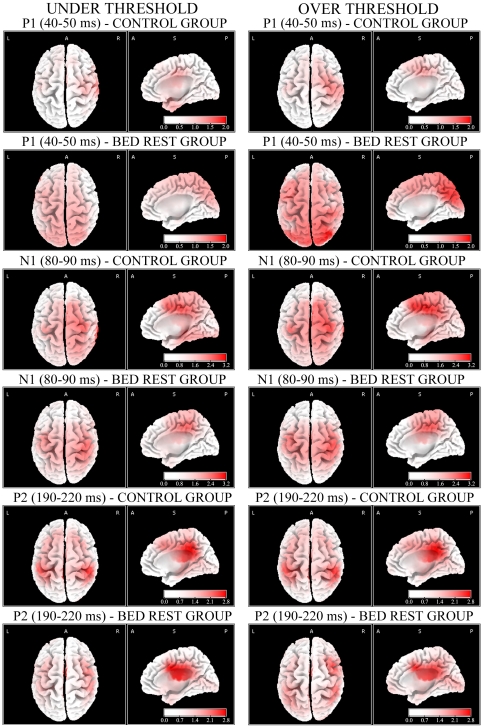
Methodology/principal findings: Twenty male subjects were randomly assigned to two groups, head-down bed rest (BR) or sitting control condition. Starting from individual electrical thresholds, Somatosensory Evoked Potentials were elicited by electrical stimuli administered randomly to the left wrist and divided into four conditions: control painless condition, electrical pain threshold, 30% above pain threshold, 30% below pain threshold. Subjective pain ratings collected during the EEG session showed significantly reduced pain perception in BR compared to Control group. Statistical analysis on four electrode clusters and sLORETA source analysis revealed, in sitting controls, a P1 component (40-50 ms) in the right somatosensory cortex, whereas it was bilateral and differently located in BR group. Controls' N1 (80-90 ms) had widespread right hemisphere activation, involving also anterior cingulate, whereas BR group showed primary somatosensory cortex activation. The P2 (190-220 ms) was larger in left-central locations of Controls compared with BR group.
Conclusions/significance: Head-down bed rest was associated to an overall decrease of pain sensitivity and an altered pain network also outside the primary somatosensory cortex. Results have implications not only for astronauts' health and spaceflight risks, but also for the clinical aspects of pain detection in bedridden patients at risk of fatal undetected complications.
Conflict of interest statement
Figures
Similar articles
-
Horizontal body position reduces cortical pain-related processing: evidence from late ERPs.PLoS One. 2013 Nov 20;8(11):e81964. doi: 10.1371/journal.pone.0081964. eCollection 2013. PLoS One. 2013. PMID: 24278467 Free PMC article. Clinical Trial.
-
Cortical activations induced by electrical versus vibrotactile finger stimulation using EEG.Neuroimage. 2025 Jul 1;314:121249. doi: 10.1016/j.neuroimage.2025.121249. Epub 2025 May 4. Neuroimage. 2025. PMID: 40328386
-
Equivalent electrical source analysis of pain-related somatosensory evoked potentials elicited by a CO2 laser.J Clin Neurophysiol. 1993 Oct;10(4):513-9. doi: 10.1097/00004691-199310000-00009. J Clin Neurophysiol. 1993. PMID: 8308146
-
[Progress in the study of pain-related somatosensory evoked potentials].Sheng Li Ke Xue Jin Zhan. 2004 Jan;35(1):19-24. Sheng Li Ke Xue Jin Zhan. 2004. PMID: 15127592 Review. Chinese.
-
Can cortical responses following noxious stimulation inform us about pain processing in neonates?Semin Perinatol. 2007 Oct;31(5):298-302. doi: 10.1053/j.semperi.2007.07.001. Semin Perinatol. 2007. PMID: 17905184 Review.
Cited by
-
Can Space Tourism Boost Sustainable Behavior?Front Psychol. 2021 Nov 19;12:771936. doi: 10.3389/fpsyg.2021.771936. eCollection 2021. Front Psychol. 2021. PMID: 34867679 Free PMC article. No abstract available.
-
Modulation of vestibular input by short-term head-down bed rest affects somatosensory perception: implications for space missions.Front Neural Circuits. 2023 Jul 13;17:1197278. doi: 10.3389/fncir.2023.1197278. eCollection 2023. Front Neural Circuits. 2023. PMID: 37529715 Free PMC article.
-
Beyond balance: The role of the Vestibular system in action recognition.Heliyon. 2024 Sep 18;10(18):e38019. doi: 10.1016/j.heliyon.2024.e38019. eCollection 2024 Sep 30. Heliyon. 2024. PMID: 39347395 Free PMC article.
-
Imaging Posture Veils Neural Signals.Front Hum Neurosci. 2016 Oct 21;10:520. doi: 10.3389/fnhum.2016.00520. eCollection 2016. Front Hum Neurosci. 2016. PMID: 27818629 Free PMC article. Review.
-
The Circadian Rhythm of Breakthrough Pain Episodes in Terminally-ill Cancer Patients.Cancers (Basel). 2018 Dec 24;11(1):18. doi: 10.3390/cancers11010018. Cancers (Basel). 2018. PMID: 30586878 Free PMC article.
References
-
- Bromm B. Pain-related components in the cerebral potential. Experimental and multivariate statistical approaches. In: Bromm B, editor. Pain measurement in man. Neurophysiological correlates of pain. Amsterdam: Elsevier; 1984. pp. 257–289.
-
- Bromm B. Evoked cerebral potential and pain. In: Fields HL, Dubner R, Cervero F, editors. Proceedings of the IVth word congress on pain. Advances in pain research and therapy (Vol. 9) New York: Raven Press; 1985. pp. 305–329.
-
- Bromm B, Lorenz J. Neurophysiological evaluation of pain. Electroenceph Clin Neurophysiol. 1998;107:227–253. - PubMed
-
- Inui K, Tran TD, Qiu Y, Wang X, Hoshiyama M, et al. A comparative magnetoencephalographic study of cortical activations evoked by noxious and innocuous somatosensory stimulations. Neuroscience. 2003;120:235–248. - PubMed
-
- Price DD. Psychological and neural mechanisms of the affective dimension of pain. Science. 2000;288:1769–1772. - PubMed
Publication types
MeSH terms
LinkOut - more resources
Full Text Sources
Medical
