. 2011;6(9):e25178.
doi: 10.1371/journal.pone.0025178. Epub 2011 Sep 16.

Targeting pannexin1 improves seizure outcome

Affiliations

Targeting pannexin1 improves seizure outcome

Marcelo F Santiago et al. PLoS One. 2011.

Abstract

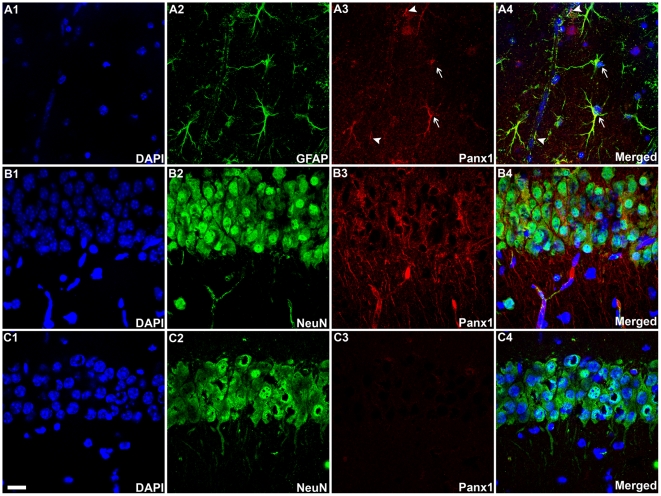
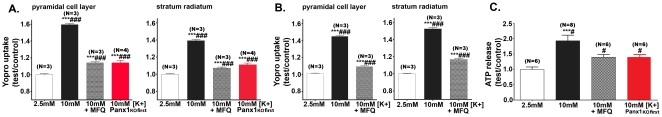
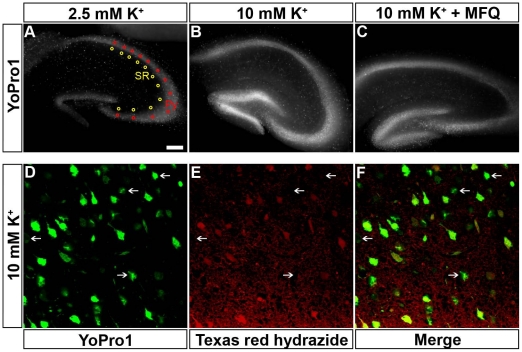
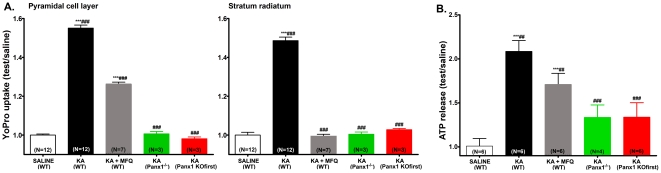
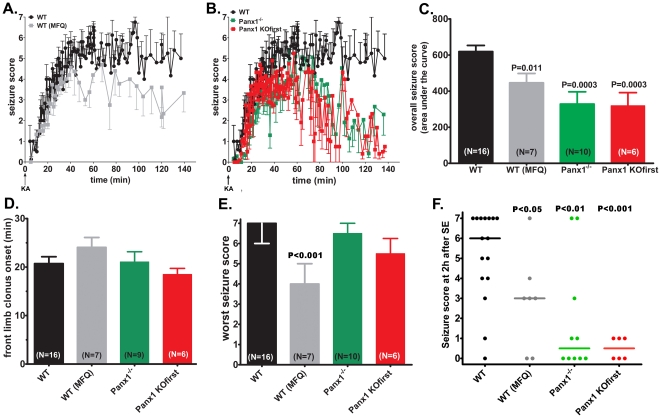
Imbalance of the excitatory neurotransmitter glutamate and of the inhibitory neurotransmitter GABA is one of several causes of seizures. ATP has also been implicated in epilepsy. However, little is known about the mechanisms involved in the release of ATP from cells and the consequences of the altered ATP signaling during seizures. Pannexin1 (Panx1) is found in astrocytes and in neurons at high levels in the embryonic and young postnatal brain, declining in adulthood. Panx1 forms large-conductance voltage sensitive plasma membrane channels permeable to ATP that are also activated by elevated extracellular K(+) and following P2 receptor stimulation. Based on these properties, we hypothesized that Panx1 channels may contribute to seizures by increasing the levels of extracellular ATP. Using pharmacological tools and two transgenic mice deficient for Panx1 we show here that interference with Panx1 ameliorates the outcome and shortens the duration of kainic acid-induced status epilepticus. These data thus indicate that the activation of Panx1 in juvenile mouse hippocampi contributes to neuronal hyperactivity in seizures.


Conflict of interest statement

Competing Interests: The authors have declared that no competing interests exist.

Figures

Figure 1
Figure 1. Pannexin1 is expressed in astrocytes and neurons in the hippocampus.
Confocal images of the stratum radiatum (A1–A4) and pyramidal cell layer (B1–B4) of the CA1 hippocampal region of P14 WT mice showing that GFAP-positive astrocytes and NeuN-positive hippocampal neurons express Panx1; nuclei were counterstained with DAPI. Note in (C1–C4) the lack of staining in the pyramidal cell layer from Panx1−/− mice. Merged images are shown in A4, B4 and C4. Arrows and arrow heads in A3–4 indicate Panx1 staining in astrocyte cell bodies and endfeet, respectively. Bar: 15 µm.
Figure 2
Figure 2. Blockade or deletion of Panx1 channels prevents membrane permeabilization of hippocampal neurons and astrocytes and attenuates ATP release from brain slices.
Bar histograms showing the fractional mean ± s.e.m. values (test/control: normalized to 2.5 mM K+ ACSF) of YoPro1 uptake induced by 10 mM K+ in the pyramidal cell layer and stratum radiatum obtained in the absence and following (A) slice incubation and (B) animal injection with MFQ. A substantial reduction in dye uptake was recorded from slices of Panx1 KOfirst mice exposed to high K+ ACSF (red bars). (C) Bar histograms showing the fractional mean ± s.e.m. amounts of ATP present in the bathing solution of hippocampal slices exposed for 1 hr to ACSF containing either 2.5 or 10 mM K+. Note the increased release of ATP in 10 mM K+ and its reduction following the blockade (MFQ: 100 nM) and deletion (Panx1 KOfirst mice) of Panx1 channels. Data displayed in panels A and B are from 3 wild type and 4 Panx1 KOfirst mice per group. The number of animals used in part C is in parentheses. ***P<0.001 and *P<0.05 between control and test conditions; ###P<0.001, ##P<0.01, and #P<0.05 between test conditions. P values were obtained from One-way Anova analysis of variance followed by Bonferroni's multiple comparison tests.
Figure 3
Figure 3. Dye uptake in hippocampal astrocytes.
(A–C) Epifluorescence images of 4% p-formaldehyde fixed hippocampal slices derived from WT mice that were exposed for 1 hr to (A) 2.5 mM and to (B–C) 10 mM K+ ACSF containing 5 µM YoPro1 in the absence (B) and presence (C) of 100 nM MFQ. YoPro1 fluorescence intensity was measured from regions of interest placed along the neuronal cell bodies in the pyramidal cell layer (Py; red circles) and in the stratum radiatum (SR; yellow circles) of the hippocampal CA1–CA3 regions. Images were acquired using an inverted epifluorescence Eclipse Nikon microscope equipped with 4× objective controlled by Metafluor software. (D) Confocal images of cells located in the stratum radiatum of the mouse hippocampus that was exposed to 10 mM K+ ACSF containing YoPro1 and the fixable astrocyte marker sulforhodamine 101 (Texas Red hydrazide), showing that the great majority of YoPro1-positive cells were also stained with Texas Red. Arrows indicate a few YoPro1-positive cells in the stratum radiatum that did not incorporate Texas Red (likely interneurons). Bar: 150 µm for top panels and 25 µm for bottom panels.
Figure 4
Figure 4. Panx1 channels contribute to membrane permeabilization during status epilepticus in mice.
(A) Bar histograms showing the fractional mean ± s.e.m. values of YoPro1 uptake in pyramidal cell layer and stratum radiatum of hippocampi of WT mice that were injected with saline (white bars), KA (black bars), MFQ and KA (gray bars), from hippocampi of KA-injected Panx1−/− (green bars) and Panx1 KOfirst (red bars) mice. (B) Bar histograms of the fractional mean ± s.e.m. values of ATP present in ACSF solutions bathing brain slices of saline-injected (white bar) and KA-injected (black and hashed bars) WT mice in the absence (black bar) and presence (gray bar) of 100 nM MFQ, and from brain slices of Panx1−/− (green bars) and Panx1 KOfirst mice (red bars). Numbers in parentheses in parts A and B are the numbers of animals used. ***P<0.001 between control and test conditions; ###P<0.001 and ##P<0.01 between test conditions. Significance calculated using One-way Anova analysis of variance followed by Bonferroni's multiple comparison tests.
Figure 5
Figure 5. Targeting Panx1 channels ameliorates seizure outcome.
(A, B) Time courses of the mean ± s.e.m. values of seizure scores measured after intraperitoneal injection of KA in (A) WT mice untreated (black symbols) and MFQ-treated (gray symbols) mice, in (B) WT (black symbols) and in two Panx1-null (Panx1−/−: green symbols, Panx1 KOfirst: red symbols) mice. (C) Bar histograms of the mean ± s.e.m. values obtained for the overall seizure scores (score×time: area under the curves) displayed on the left panels. Note in panel C that MFQ-treated WT mice and the two Panx1-null mouse lines displayed significant behavioral improvements (smaller areas under the curve) compared to WT mice and that the overall seizure severity of MFQ-treated WT mice were not significantly different from those of two Panx1-null mouse lines. (D–E) Bar histograms of the (D) mean ± s.e.m. values of the onset time of forelimb stiff, and of the median ± interquartile range values of (E) the worst seizure score recorded during the time course of observation. Numbers in parentheses are the number of animals used in each group. Part F shows the scatter dot plots with their respective median values of the seizure score at 2 hr after SE of KA-injected (black), MFQ- and KA -injected WT mice (gray), and KA-injected Panx1-null (Panx1−/−: green, Panx1 KOfirst: red) mice. Values in parts C and D are mean ± s.e.m. and the indicated P values were obtained from One-way Anova analysis of variance followed by Newman-Keuls multiple comparison test. Values in part E are medians with interquartile range, and horizontal lines in part F are the median values obtained for the scatter dot plots. Indicated P values in parts E and F were obtained from non-parametric statistical analysis Kruskal-Wallis of variance followed by Dunn's test. In part D, only 9 animals were analyzed because one of ten Panx1−/− mice did not display forelimb stiff.

References

    1. Fields RD, Burnstock G. Purinergic signalling in neuron-glia interactions. Nat Rev Neurosci. 2006;7:423–436. - PMC - PubMed
    1. Wieraszko A, Seyfried TN. Increased amount of extracellular ATP in stimulated hippocampal slices of seizure prone mice. Neurosci Lett. 1989;106:287–293. - PubMed
    1. Lopatar J, Dale N, Frenguelli BG. Minor contribution of ATP P2 receptors to electrically-evoked electrographic seizure activity in hippocampal slices: Evidence from purine biosensors and P2 receptor agonists and antagonists. Neuropharmacology. 2011;61:25–34. - PubMed
    1. Seifert G, Schilling K, Steinhauser C. Astrocyte dysfunction in neurological disorders: a molecular perspective. Nat Rev Neurosci. 2006;7:194–206. - PubMed
    1. Thompson RJ, Jackson MF, Olah ME, Rungta RL, Hines DJ, et al. Activation of pannexin-1 hemichannels augments aberrant bursting in the hippocampus. Science. 2008;322:1555–1559. - PubMed

Publication types

MeSH terms