. 2011 Nov 17;118(20):5652-63.
doi: 10.1182/blood-2011-05-355339. Epub 2011 Sep 27.

Erythrocyte membrane changes of chorea-acanthocytosis are the result of altered Lyn kinase activity

Affiliations

Erythrocyte membrane changes of chorea-acanthocytosis are the result of altered Lyn kinase activity

Lucia De Franceschi et al. Blood. .

Abstract

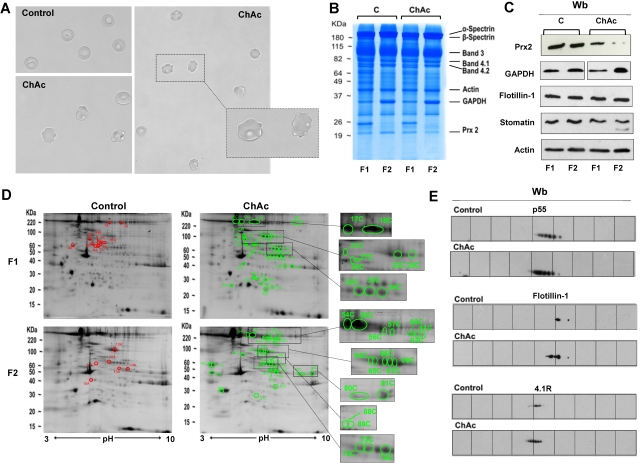
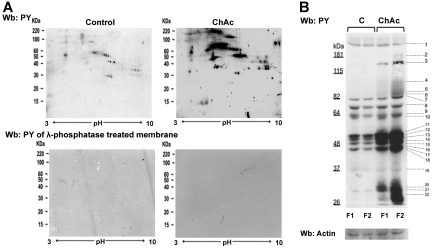
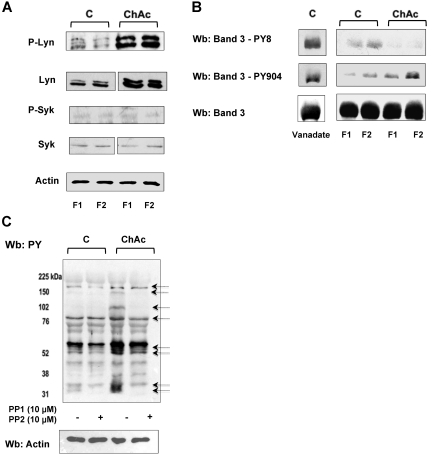
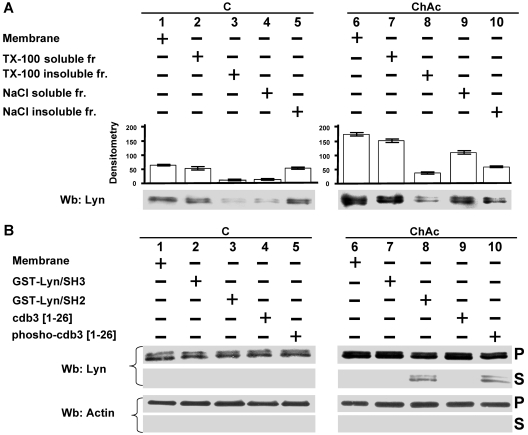
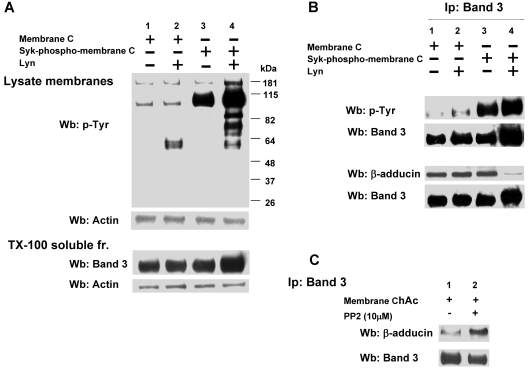
Acanthocytic RBCs are a peculiar diagnostic feature of chorea-acanthocytosis (ChAc), a rare autosomal recessive neurodegenerative disorder. Although recent years have witnessed some progress in the molecular characterization of ChAc, the mechanism(s) responsible for generation of acanthocytes in ChAc is largely unknown. As the membrane protein composition of ChAc RBCs is similar to that of normal RBCs, we evaluated the tyrosine (Tyr)-phosphorylation profile of RBCs using comparative proteomics. Increased Tyr phosphorylation state of several membrane proteins, including band 3, β-spectrin, and adducin, was noted in ChAc RBCs. In particular, band 3 was highly phosphorylated on the Tyr-904 residue, a functional target of Lyn, but not on Tyr-8, a functional target of Syk. In ChAc RBCs, band 3 Tyr phosphorylation by Lyn was independent of the canonical Syk-mediated pathway. The ChAc-associated alterations in RBC membrane protein organization appear to be the result of increased Tyr phosphorylation leading to altered linkage of band 3 to the junctional complexes involved in anchoring the membrane to the cytoskeleton as supported by coimmunoprecipitation of β-adducin with band 3 only in ChAc RBC-membrane treated with the Lyn-inhibitor PP2. We propose this altered association between membrane skeleton and membrane proteins as novel mechanism in the generation of acanthocytes in ChAc.


Figures

Figure 1
Figure 1
Proteomic analysis of RBC membrane fractions shows differences in ChAc compared with healthy controls. (A) Morphology of RBCs from control and ChAc subjects. (B-E) RBCs from control (C) and ChAc were fractionated in fraction 1 (F1) corresponding to a density < 1.074, containing reticulocytes, and fraction 2 (F2) corresponding to a density > 1.092, containing acanthocytes. (B) The fractionated RBC membrane proteins were separated by 1DE and stained with colloidal Coomassie blue. The bands that were identified by mass spectrometry are indicated: β-spectrin (accession no. P11277), 48% coverage; β-spectrin (accession no. P02549), 52% coverage; band 3 (accession no. P027330), 25% coverage; band 4.1R (accession no. P11171), 22% coverage; band 4.2 (accession no. P16452), 18% coverage; β-actin (accession no. P60709), 26% coverage; GAPDH (accession no. P04406), 18% coverage; and Prx-2 (accession no. P32119), 32% coverage. The figure shows a representative of 9 experiments performed with similar results. (C) Western blot (Wb) analysis of RBC membranes separated by 1DE with specific antibodies against Prx-2, GAPDH, flotillin-1, and stomatin proteins of fractionated RBCs from controls (C) and ChAc subjects. Actin was used as loading control. The data are representative for 8 experiments. (D-E) The membrane proteins of fractionated RBCs (see “Study design”) were separated by 2DE. Twin 2DE gels were run: one stained with colloidal Coomassie and the other transferred to membrane for Western blot analysis. (D) The colloidal Coomassie blue–stained gels underwent image analysis, and differently expressed proteins were identified by mass spectrometry (see “Comparative proteomic analysis”; supplemental Methods). Red and green spots indicated the differently expressed proteins based on image analysis. The identified proteins are reported in supplemental Table 2. The figures show 1 representative experiment from a total 8 experiments performed. (E) Western blot (Wb) analysis of the 2DE maps with specific anti–protein p55 antibody on F1 RBCs from control and ChAc subjects (validating the differently expressed spots 32C, 33C, and 34C in panel 1D and supplemental Table 2), anti–flotillin-1 antibody on F1 RBCs from control and ChAc subjects (validating the differently expressed spots 40C in panel D and supplemental Table 2), and anti–protein 4.1R antibody on F2 RBCs from control and ChAc subjects (validating the differently expressed spots 64C-68C in panel D and supplemental Table 2). The figures show one representative experiment of 3 experiments performed with similar results.
Figure 2
Figure 2
Tyr phosphorylation of RBC membrane protein is increased in ChAc compared with normal controls. RBCs from control (C) and ChAc subjects were fractionated as described in “Study design” and in the legend of Figure 1B-E. Western blot (Wb) analysis with specific anti–phosphotyrosine (PY) antibodies of RBC membrane proteins separated by either bidimensional electrophoresis (2DE) or monodimensional electrophoresis (1DE). (A) Twin 2DE gels were run: one used for colloidal Coomassie-stained gels (Figure 1D) and the other for the Western blot analysis with specific anti–phosphotyrosine (PY) antibodies. Top panel: Membranes of high-density RBC fraction (F2) from control (C) and ChAc subjects. Similar results were also obtained in low-density RBC fraction (F1) from control and ChAc (data not shown). Bottom panel: Dephosphorylation of blotted proteins by recombinant λ protein phosphatase (400 U/mL). The blotted membranes were incubated in TBS containing 1% BSA, 0.1% Triton X-100, 2mM MnCl2 (overnight at 4°C), and then probed with anti–phosphotyrosine antibodies. The data are representative for 3 experiments with similar results. (B) 1DE gels (13 cm) were blotted for Western blot (Wb) analysis with specific anti–phosphotyrosine (PY) antibodies. The bands with different staining intensities were identified by mass spectrometry (Table 2; “Comparative proteomic analysis”; supplemental Methods). Actin was used as a loading control. The data are representative of 8 experiments. See also supplemental Figure 1B for densitometric analysis of the Tyr phosphorylation profile of the RBC membrane proteins.
Figure 3
Figure 3
ChAc RBCs show increased Lyn Tyr kinase associated with the membrane. RBCs from control (C) and ChAc were fractionated as described in “Study design” and in the legend of Figure 1B-E. (A) Western blot analysis with specific antibodies of membrane-associated Tyr kinase Lyn and phospho-Lyn (p-Lyn), Syk, and phospho-Syk (p-Syk). Actin was used as a loading control. Shown is a representative of 6 experiments. Vertical line(s) have been inserted to indicate a repositioned gel lane. (B) Western blot (Wb) analysis with specific antibodies against Tyr-8 on the N-terminal of band 3, as a Syk target, and Tyr-904 on the transmembrane domain of band 3 (as a Lyn target). We used normal RBCs treated with Na-vanadate (see “Study design”) as positive controls. Total band 3 was used as loading control. (C) Western blot (Wb) analysis with specific anti–phosphotyrosine (PY) antibodies of high-density fraction (F2) of RBCs from control (C) and ChAc subjects are shown. The F2 RBCs were incubated with or without the Src family kinase inhibitors PP1 (10μM) and PP2 (10μM) as previously reported. The arrows indicated the bands affected by PP1-PP2 treatment in ChAc RBCs compared with untreated ChAc RBCs. The data are representative of 3 experiments (on 6-cm gels). Actin was used as a loading control. The data are representative of 3 experiments. Similar results were also obtained with cells from low density fraction (F1) control and ChAc RBCs (data not shown).
Figure 4
Figure 4
Modes of interaction of Lyn with membranes from ChAc RBCs. (A) Membranes of F2 RBCs from control (C) and ChAc subjects were extracted with Triton X-100 or NaCl (see “RBC morphology, membrane preparation, and membrane cytoskeleton extraction”) and assayed after ultracentrifugation for the presence of Lyn by Western blot (Wb) analysis. The data shown here are obtained with F2 ChAc RBCs. Similar data were obtained with F1 control and ChAc RBCs (data not shown). (B) Membranes of F2 RBCs from control (C) and ChAc subjects were incubated in the presence or absence of GST-Lyn/SH3, GST-Lyn/SH2, cdb3, or phospho (p)–cdb3 and assayed after ultracentrifugation for Lyn in the resulting soluble (S) and pellet (P) fractions for the presence of Lyn by Western blot (Wb) analysis. Similar data were obtained from F1 control and ChAc RBCs (data not shown). The membranes were reprobed with anti–actin antibody as loading control.
Figure 5
Figure 5
Phosphorylation patterns of normal and ChAc RBC membranes by exogenous Lyn. Membranes of high-density fraction (F2) of RBCs from control (C) and ChAc subjects were incubated without (lanes 1 and 5) or with exogenous Lyn (lanes 2-4 and 6-8) and with GST-Lyn/SH3 (lanes 3 and 7) or GST-Lyn/SH2 (lanes 4 and 8), respectively. Samples were then analyzed by Western blot (Wb) analysis with anti–phosphotyrosine antibodies. Similar data were obtained with F1 control and ChAc RBCs (data not shown). The membranes were reprobed with anti–actin antibody as loading control.
Figure 6
Figure 6
Effect of phosphorylation of RBC membranes by Syk and/or Lyn on band 3 binding to β-adducin in normal and ChAc RBC membranes. (A) Membranes (lanes 1 and 2) or Syk-phospho-membranes (lanes 3 and 4) of F2 RBCs from control (C) were incubated without (lanes 1 and 3) or with exogenous Lyn (lanes 2 and 4) and subjected to Western blot analysis with anti–phospho-Tyr (anti–pTyr) antibody (top panel) or were extracted with Triton X-100 and assayed after ultracentrifugation for the presence of band 3 by Western blot analysis (bottom panel). The membranes were reprobed with anti–actin antibody as loading control. (B) Band 3 was immunoprecipitated from membranes (lanes 1 and 2) and Syk-phospho-membranes (lanes 3 and 4) of F2 RBCs from C after incubation without (lanes 1 and 3) or with exogenous Lyn (lanes 2 and 4). The immunoprecipitates were subjected to Western blot analysis with anti–pTyr (top panel), anti–β-adducin antibody. The blots were also probed with anti–band 3 antibody. (C) Band 3 was immunoprecipitated from membranes of F2 ChAc RBCs previously incubated without or with the inhibitor PP2 (10μM). The immunoprecipitates were subjected to Western blot analysis with anti–β-adducin antibody. The blots were also probed with anti–band 3 antibody. The figure is representative of 3 independent experiments.

References

    1. Danek A, Jung HH, Melone MA, Rampoldi L, Broccoli V, Walker RH. Neuroacanthocytosis: new developments in a neglected group of dementing disorders. J Neurol Sci. 2005;229–230:171–186. - PubMed
    1. Danek A, Walker RH. Neuroacanthocytosis. Curr Opin Neurol. 2005;18(4):386–392. - PubMed
    1. Jung HH, Danek A, Frey BM. McLeod syndrome: a neurohaematological disorder. Vox Sang. 2007;93(2):112–121. - PubMed
    1. Rampoldi L, Danek A, Monaco AP. Clinical features and molecular bases of neuroacanthocytosis. J Mol Med. 2002;80(8):475–491. - PubMed
    1. Velayos-Baeza A, Levecque C, Dobson-Stone C, Monaco AP. The function of chorein. In: Walker RH, Saiki S, Danek A, editors. Neuro-acanthocytosis Syndromes II. Berlin, Germany: Springer-Verlag; 2008. pp. 87–105.

Publication types

MeSH terms