. 2011 Nov;23(11):1029-42, e498.
doi: 10.1111/j.1365-2982.2011.01784.x. Epub 2011 Sep 25.

Movement based artifacts may contaminate extracellular electrical recordings from GI muscles

Affiliations

Movement based artifacts may contaminate extracellular electrical recordings from GI muscles

O Bayguinov et al. Neurogastroenterol Motil. 2011 Nov.

Abstract

Background: Electrical slow waves drive peristaltic contractions in the stomach and facilitate gastric emptying. In gastroparesis and other disorders associated with altered gastric emptying, motility defects have been related to altered slow wave frequency and disordered propagation. Experimental and clinical measurements of slow waves are made with extracellular or abdominal surface recording.

Methods: We tested the consequences of muscle contractions and movement on biopotentials recorded from murine gastric muscles with array electrodes and pairs of silver electrodes.

Key results: Propagating biopotentials were readily recorded from gastric sheets composed of the entire murine stomach. The biopotentials were completely blocked by nifedipine (2 μmol L(-1) ) that blocked contractile movements and peristaltic contractions. Wortmannin, an inhibitor of myosin light chain kinase, also blocked contractions and biopotentials. Stimulation of muscles with carbachol increased the frequency of biopotentials in control conditions but failed to elicit biopotentials with nifedipine or wortmannin present. Intracellular recording with microelectrodes showed that authentic gastric slow waves occur at a faster frequency typically than biopotentials recorded with extracellular electrodes, and electrical slow waves recorded with intracellular electrodes were unaffected by suppression of movement. Electrical transients, equal in amplitude to biopotentials recorded with extracellular electrodes, were induced by movements produced by small transient stretches (<1 mm) of paralyzed or formalin fixed gastric sheets.

Conclusions & inferences: These data demonstrate significant movement artifacts in extracellular recordings of biopotentials from murine gastric muscles and suggest that movement suppression should be an obligatory control when monitoring electrical activity and characterizing propagation and coordination of electrical events with extracellular recording techniques.


Conflict of interest statement

CONFLICT OF INTEREST

There are no conflicts of interest to disclose.

Figures

Figure 1
Figure 1
Biopotentials recorded from gastric sheet with extracellular array electrodes (A; see Methods for details). Events were characterized by oscillatory potentials and propagated from electrode to electrode. (B) Compares recordings of biopotentials with bipolar silver wire electrodes (250 μm) placed on the surface of the gastric sheet.
Figure 2
Figure 2
Effects of nifedipine on biopotentials recorded with extracellular array electrodes. (A) Shows control recordings of regular complexes of oscillatory biopotentials. After treatment with nifedipine (1 μmol L−1; B), the amplitude of the biopotentials decreased and oscillations after the initial deflection were blocked. Movement (contractions) were reduced but not blocked by 1 μmol L−1 nifedipine. This partial suppression of movement caused the biopotentials to take on the typical waveform associated with extracellular recording (see inset). (C) Shows electrical activity after 2 μmol L−1 nifedipine which reduced contractile movements (see Figs 7 and 8).
Figure 3
Figure 3
Comparison of monopolar and bipolar recording. Biopotentials were recorded from single electrodes within the electrode array in reference to a bath ground electrode (Aa) or with two adjacent electrodes within the array in reference to each other (Ba). In both cases the biopotentials had similar frequencies and waveforms, and in both recording configurations, the biopotentials were blocked by nifedipine (2 μmol L−1; Ab and Bb).
Figure 4
Figure 4
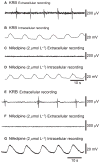
Extracellular and intracellular recording in the same muscles. (A and B) Show simultaneous recordings using an extracellular array electrode in monopolar mode and an intracellular microelectrode. Impalements were extremely difficult to maintain under these circumstances because of muscle contractions. In this example contractions were small and the biopotentials had the typical triphasic waveform associated with extracellular recording of slow waves. Recordings were made in different portions of the gastric sheet, so the phasic relationship between biopotentials and slow waves is not of significance. In this stomach, slow waves occurred at the same frequency as the biopotentials. (C and D) Show recordings from the same muscle after treatment with nifedipine (2 μmol L−1). Intracellular recording is from a different impalement than in (B). Note that intracellular recording is lost by nifedipine, but there is no loss of slow waves, as shown by the intracellular recording. (E and F) Show the same effect of nifdipine on biopotentials recorded by extracellular electrodes in another gastric sheet. In this example, and with many other preparations, we were unable to sustain impalements during the extracellular recordings of biopotentials due to muscle contractions. After addition of nifedipine (which suppressed movement) cells were impaled, and these recordings confirmed that slow waves were sustained after loss of biopotentials (G).
Figure 5
Figure 5
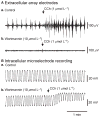
Effects of cholinergic stimulation on biopotentials and electrical slow waves in gastric muscles. (A) Shows recordings via extracellular array electrodes. Regular biopotential complexes were noted under control conditions (a). CCh (1 μmol L−1) increased the frequency of the biopotentials, and noisy electrical deflections between complexes were often noted at the beginning of responses to CCh. The second trace (b) shows block of the biopotential complexes by nifedipine (2 μmol L−1). In the presence of nifedpine, CCh caused only small irregular deflections at the beginning of the response. (B) Compares the electrical activity recorded from gastric sheets with intracellular microelectrodes. In (a) slow wave activity was recorded upon impalement of smooth muscle cells. In (b) nifedipine (2 μmol L−1) did not significantly reduce slow waves. Addition of CCh (1 μmol L−1), in the presence of nifedipine, caused depolarization and increased slow wave frequency. This is the normal response of gastric muscles to muscarinic stimulation.
Figure 6
Figure 6
Effects of wortmannin on biopotentials and electrical slow waves in gastric muscles. (A) Shows biopotentials recorded with extracellular array electrodes. Rhythmic biopotential complexes were noted under control conditions (a). CCh (1 μmol L−1) increased the frequency of the biopotentials, and noisy electrical deflections were often noted between complexes at the beginning of responses to CCh. Wortmannin treatment (10 μmol L−1; trace b) blocked contractile movements and biopotentials in gastric muscles. In the presence of wortmannin CCh had no effect on electrical activity recorded with extracellular electrodes. (B) Compares effects of wortmannin on electrical activity recorded by an intracellular microelectrode. In (a) normal slow wave activity was recorded in control conditions. Treatment with wortmannin (b) had no effect on slow waves, and CCh (1 μmol L−1) caused depolarization and increased slow wave frequency.
Figure 7
Figure 7
Inhibition of contractile movements by nifedipine. Nifedipine, an inhibitor of voltage-dependent Ca2+ channels in gastric muscles, blocked peristaltic contractions in gastric flat sheet preparations. (A) Shows an image of the stomach, opened along the lesser curvature and pinned as a flat-sheet. The two halves of the esophagus are at the top of the image and the duodenum is located at the bottom of the image as labeled. Small inert dots were placed on the surface of the gastric sheet to monitor small changes in position. Movements of the gastric sheet were monitored by video camera. Decreases in gastric diameter (muscle contractions) were calculated as changes in distance between the left and right edges of the gastric sheet and spatio-temporal maps were constructed to display the spread of (peristaltic) contractions. (B) Shows a spatio-temporal map of control activity consisting of regularly occurring, large amplitude contractions that propagated from the corpus to the antrum (white diagonal streaks; arrow depicts direction and rate of propagation). (C) Shows a spatio-temporal map after addition of nifedipine (2 μmol L−1). Propagating contractions were not observed after nifedipine. Scale in (C) shows gray-scale mapping of contractions in (B and C). (see dotted rectangle in A). (D) Shows traces of movements of a centrally located surface marker (see dotted rectangle in A) during control and after exposure to nifedipine (2 μmol L−1). Movement was blocked by nifedipine.
Figure 8
Figure 8
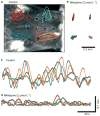
Analysis of surface marker movements. (A) Shows a flat-sheet preparation of stomach and the trajectories of four surface markers during 4.5 slow wave cycles are overlaid in color. Each surface marker had a unique trajectory, with varying degrees of circumferential movements (Y-axis) and longitudinal movements (X-axis). (B) After the addition of nifedipine (2 μmol L−1), movement of surface markers was suppressed significantly. (C) Shows the distance of each marker from its average XY center in control conditions. Note the varied waveforms and phase-relation between traces; even between markers arranged circumferentially to one another (red–blue and green– orange) show varying spatial relations. (D) Shows the reduction in the amplitude of movements after nifedipine (2 μmol L−1).
Figure 9
Figure 9
Movement can induce biopotentials in gastric muscles. (A) Shows biopotentials recorded with extracellular silver electrodes. The biopotentials (B) were blocked by nifedipine (2 μmol L−1). (C) Shows induction of electrical transients of equal magnitude to the biopotentials induced by small (<1 mm) stretches of the gastric sheet from the pyloric end. Stretches of the muscle (1–5 stretches applied as noted in C), resulted in 1: 1 electrical transients picked up by the extracellular electrodes placed in the mid-body region of the gastric sheets.
Figure 10
Figure 10
Expected kinetics of slow waves in extracellular recordings based on measurements of membrane potential and Ca2+ transients in cells of Cajal (ICC) and networks. (A) Shows a transmembrane potential recording of electrical slow waves from an ICC within the ICC-MY network in the murine small intestine. Upstroke velocity exceeds 1 V s−1 and the upstroke depolarization is completed in about 50–75 ms. The 1st derivate [dV/dt] (red trace), and 2nd derivative [d2V/dt2] (blue trace) are displayed below. The 2nd derivative approximates an extracellular recording in volume from a single cell (Ref. 2). (B) Shows a 400 μm wide field showing the ICC-MY network that was loaded with the Ca2+ dye, Fluo 4 (data provided by Dr. Hyun-Tai Lee; Ref. 43). Ca2+ transients in ICC within the ICC-MY network during the propagation of a slow wave (Ref. 43) are displayed in the upper three panels, and the progress of a slow wave is noted by the time register in the lower right portion of each panel. The bottom panel (ICC BitMask) was used to calculate the Ca2+-induced fluorescence in the entire ICC-MY network in this field of view (FOV). (C) Shows Ca2+ transients calculated from three ICC (ROIs denoted in the bottom panel of B) within the ICC-MY network, and 1st and 2nd derivatives of the Ca2+ transient depicted by the black trace are shown in red and blue, respectively. The duration of the upstroke phase of Ca2+ transients associated with slow waves in individual cells is ~250 ms which is 3–4 times slower than the velocity of the electrical upstroke depolarization during slow waves (see A). (D) Shows Ca2+ transients calculated from the entire ICC-MY network in the FOV and 1st and 2nd derivatives are shown below in red and blue, respectively. The duration of the upstroke of Ca2+ transients calculated from the entire FOV, was ~350 ms. Using the factor (3.33) deduced from (A and C) (difference in rate of rise of the electrical upstroke vs the Ca2+ transient associated with slow waves), this suggests that the electrical upstroke of slow waves from ICC within the FOV would have been about 100 ms.

Comment in

References

    1. Alvarez WC, Mahoney LJ. Action current in stomach and intestine. Am J Physiol. 1922;58:476–93.
    1. Bortoff A. Slow potential variation of small intestine. Am J Physiol. 1961;201:203–8.
    1. Kobayashi M, Prosser CL, Nagai T. Electrical properties of intestinal muscle as measured intracellularly and extracellularly. Am J Physiol. 1967;213:275–86. - PubMed
    1. Bortoff A. Configuration of intestinal slow waves obtained by monopolar recording techniques. Am J Physiol. 1967;213:157–62. - PubMed
    1. Boev K, Golenhofen K. Sucrose-gap technique with pressed-rubber membranes. PflugersArch. 1974;349:277–83. - PubMed

Publication types

MeSH terms