. 2011 Sep 27:7:533.
doi: 10.1038/msb.2011.68.

The MHC I immunopeptidome conveys to the cell surface an integrative view of cellular regulation

Affiliations

The MHC I immunopeptidome conveys to the cell surface an integrative view of cellular regulation

Etienne Caron et al. Mol Syst Biol. .

Abstract

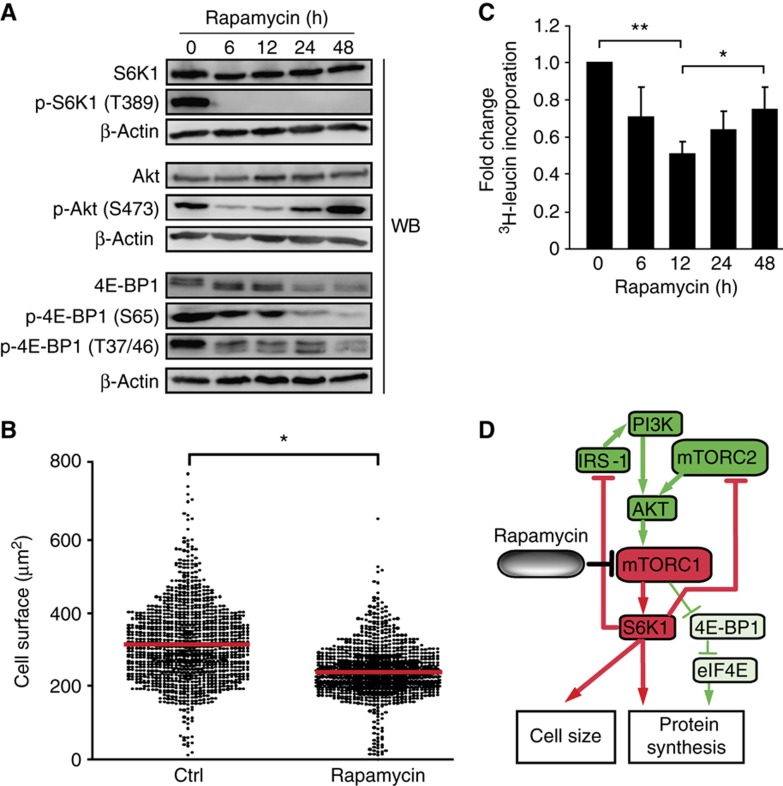
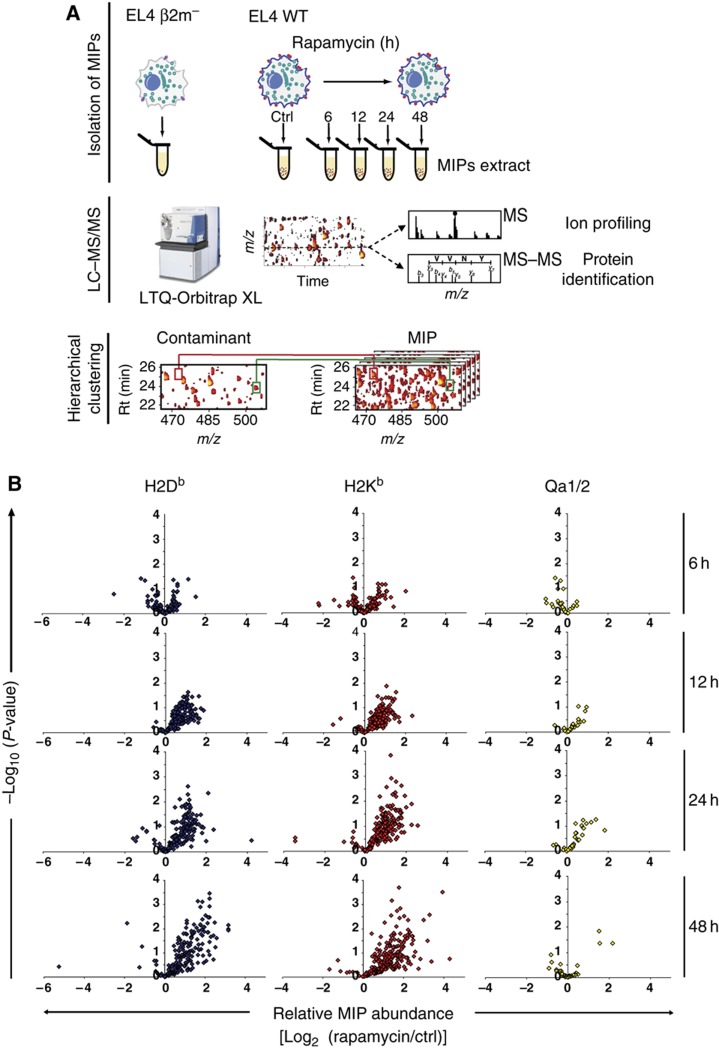
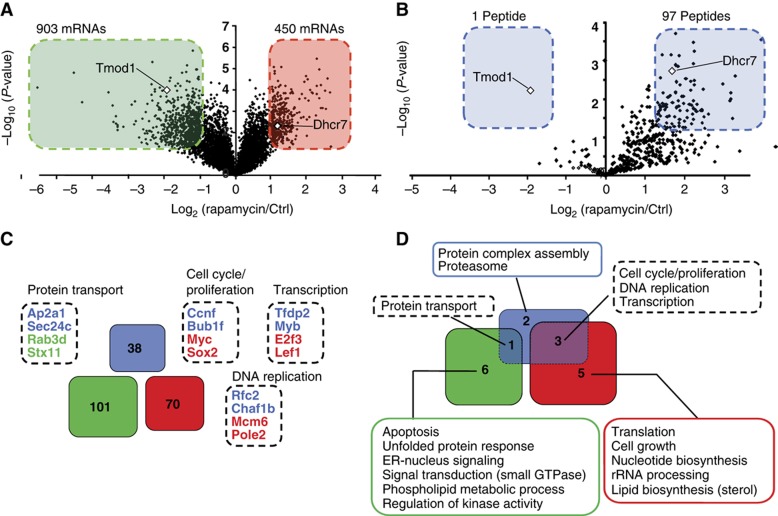
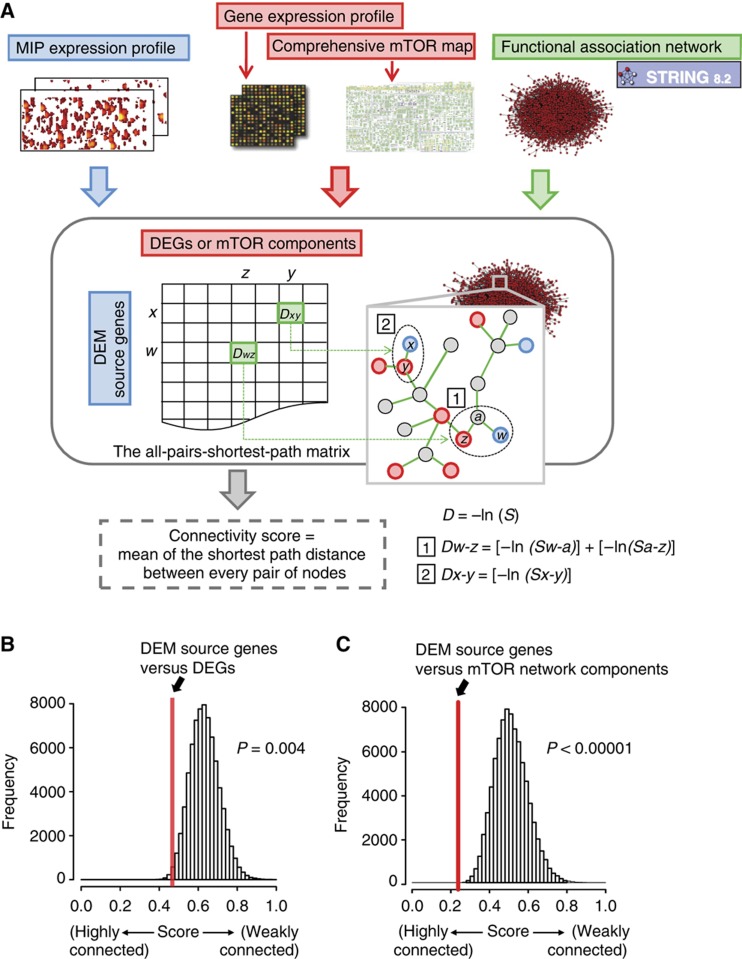
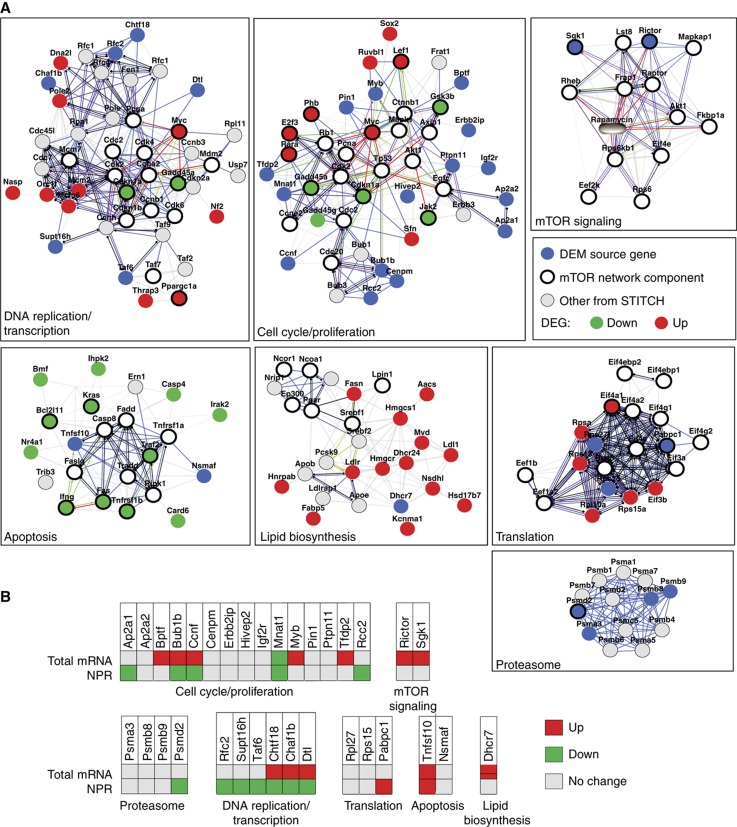
Self/non-self discrimination is a fundamental requirement of life. Endogenous peptides presented by major histocompatibility complex class I (MHC I) molecules represent the essence of self for CD8 T lymphocytes. These MHC I peptides (MIPs) are collectively referred to as the immunopeptidome. From a systems-level perspective, very little is known about the origin, composition and plasticity of the immunopeptidome. Here, we show that the immunopeptidome, and therefore the nature of the immune self, is plastic and moulded by cellular metabolic activity. By using a quantitative high-throughput mass spectrometry-based approach, we found that altering cellular metabolism via the inhibition of the mammalian target of rapamycin results in dynamic changes in the cell surface MIPs landscape. Moreover, we provide systems-level evidence that the immunopeptidome projects at the cell surface a representation of biochemical networks and metabolic events regulated at multiple levels inside the cell. Our findings open up new perspectives in systems immunology and predictive biology. Indeed, predicting variations in the immunopeptidome in response to cell-intrinsic and -extrinsic factors could be relevant to the rational design of immunotherapeutic interventions.


Conflict of interest statement

The authors declare that they have no conflict of interest.

Figures

Figure 1
Figure 1
Rapamycin differentially inhibits S6K1 versus 4E-BP1 in EL4 cells. Cells were treated with 20 ng/ml of rapamycin for the indicated time periods. (A) Levels of the indicated proteins were determined by western blotting. β-Actin served as a loading control. Data are representative of three independent experiments. (B) EL4 cells were treated or not (ctrl) with rapamycin for 48 h. One thousand cells were counted for each condition. Cell size was measured by light microscopy. The red line corresponds to the average cell size. Data are representative of three independent experiments. *P<0.0005 (Student's t-test). (C) Relative protein synthesis was measured by [3H]-leucine incorporation. Data (mean±s.d.) are representative of three independent experiments. *P<0.01, **P<0.005 (Student's t-test). (D) Model for effects of rapamycin-mediated mTORC1 inhibition in EL4 cells. Proteins and reactions were curated from the literature. Color code is based on the results in Figure 1 after 48 h of rapamycin treatment. Activation and inhibition of components/reactions are depicted in green and red, respectively. Partial inactivation is represented by the thinner green lines.
Figure 2
Figure 2
Rapamycin increases the abundance of MIPs presented by MHC Ia molecules. (A) Experimental design for identification and relative quantification of MIPs. EL4 cells were incubated with 20 ng/ml of rapamycin for 0 h (ctrl), 6, 12, 24 and 48 h. Cells from all experimental conditions were harvested simultaneously. MIPs from rapamycin-treated and ctrl EL4 cells were isolated by mild acid elution and analyzed by nanoLC–MS–MS/MS. Heat maps displaying m/z, retention time and abundance were generated. A logarithmic intensity scale distinguishes between low (dark red) and high (bright yellow) abundance species. Analysis of β2m- mutant EL4 cells allows discrimination of genuine MIPs from contaminants (Fortier et al, 2008; de Verteuil et al, 2010). Examples of peptides that were differentially expressed (red line) or not (green line) between WT and β2m- mutant EL4 cells are highlighted in the boxes. (B) Volcano plots show the relative abundance of 416 H2b-associated peptides identified in three biological replicates at each time point. Six MIPs were detected uniquely after 48 h of rapamycin treatment.
Figure 3
Figure 3
Rapamycin-mediated mTOR inhibition induces functionally coherent changes in the transcriptome and the immunopeptidome. (A) Volcano plot representation of the relative abundance of 42 586 transcripts after 48 h of rapamycin treatment. Transcripts were considered to be differentially expressed when the fold difference in abundance was >2.0 (P<0.05). Transcripts over- and underexpressed in rapamycin-treated cells relative to ctrl cells are depicted in the red and green boxes, respectively. (B) Volcano plot representation of the relative abundance of 422 MIPs after 48 h of rapamycin treatment. MIPs that were the most differentially expressed (fold difference relative to untreated cells >2.5; P<0.05; fold difference and P-value based on Fortier et al, 2008) are highlighted in the blue boxes. (C, D) GO enrichment analyses were performed for DEM source genes and DEGs. In all, 38 DEM source genes (blue) were associated to 6 significantly enriched cellular processes. In all, 101 (green) and 70 (red) genes coding for under- and overexpressed mRNAs were associated to 7 and 8 significantly enriched cellular processes, respectively. (C) Venn diagram showing no overlap between DEM source genes and DEGs. Dashed boxes show representative genes that contributed to enrichment of four cellular processes in both DEM source genes and DEGs. (D) Venn diagram showing functional overlap between cellular processes overrepresented in DEM source genes and DEGs. The four cellular processes overrepresented in both DEM source genes and DEGs are listed in the dashed boxes.
Figure 4
Figure 4
DEM source genes are tightly connected to transcriptomic changes and the mTOR network. (A) An all-pairs-shortest-path matrix was developed by using computed scores (S) in the STRING database (http://string-db.org/). The all-pairs-shortest-path matrix was used to calculate functional associations between (1) DEM source genes and DEGs and (2) DEM source genes and mTOR network components. Each functional association in the all-pairs-shortest-path matrix was transformed into a distance (D). The matrix shows DEM source genes (rows), DEGs or mTOR network components (columns), and the shortest path distance between every pair of nodes (genes/proteins) in the association network (e.g. Dw-z and Dx-y). A connectivity score corresponds to the mean of the shortest path distance between every pair of nodes in a given matrix. (B, C) The all-pairs-shortest-path matrix was used to calculate functional connectivity scores. The red lines represent the connectivity score between DEM source genes and DEGs (B), and between DEM source genes and mTOR network components (C). A bootstrap procedure was used to calculate control connectivity scores represented by the Gaussian distributions.
Figure 5
Figure 5
DEM source genes are regulated at multiple layers within specific mTOR subnetworks. (A) The STITCH database (http://stitch.embl.de/) was used to generate a network from protein–protein interactions and functional associations involving identified DEM source genes, DEGs and mTOR network components. From the total network, subnetworks of DNA replication/transcription, cell cycle/proliferation, apoptosis, lipid biosynthesis, translation, proteasome and mTOR signaling were extracted. Legend for functional associations (edges) is depicted in Supplementary Figure S4. (B) EL4 cells were treated or not with rapamycin for 48 h. Total mRNA and NPR levels of the DEM source genes depicted in (A) were assessed by quantitative real-time PCR (see also Supplementary Table S6).
Figure 6
Figure 6
Relative abundance and stability of eight DEM source proteins in the presence or absence of rapamycin. EL4 cells were treated or not (ctrl) with 20 ng/ml of rapamycin for 48 h. Levels of DEM source proteins were determined by western blotting and quantified by densitometry. Fold change indicates the rapamycin/ctrl protein abundance ratio. To estimate the half-life of DEM source proteins, cells were treated with cycloheximide (CHX) for 0, 4 and 8 h in the presence and absence of rapamycin. Results in the graphs are expressed as a percentage of the remaining protein abundance in CHX-treated cells relative to CHX-untreated cells. β-Actin served as a loading control. One representative western blot out of three is shown for individual proteins (P-value: Student's t-test). Source data is available for this figure in the Supplementry Information.
Figure 7
Figure 7
Rapamycin-treated cells contain increased levels of proteasomal substrates and express antigenic MIPs. (A, B) EL4 cells were treated or not with 20 ng/ml rapamycin for 48 h, combined or not with 10 μM of lactacystin for the last 8 h. (A) Accumulation of ubiquitinated proteins was measured on total cell lysates by western blotting. (B) Polyubiquitinated proteins from total cell lysates were isolated with TUBEs and levels of polyubiquitinated Rictor were then determined by western blotting. One representative western blot out of three is shown. (C, D) Mice were immunized with DCs coated with VNTHFSHL (C) or KALSYASL (D) peptide. Splenocytes from primed mice were tested for cytotoxic activity against CFSE-labeled target EL4 cells at different E/T ratios. EL4 cells coated with VNTHFSHL or KALSYASL were used as positive control. Data represent the mean±s.d. for three mice per group. Source data is available for this figure in the Supplementry Information.

References

    1. Araki K, Turner AP, Shaffer VO, Gangappa S, Keller SA, Bachmann MF, Larsen CP, Ahmed R (2009) mTOR regulates memory CD8 T-cell differentiation. Nature 460: 108–112 - PMC - PubMed
    1. Barnea E, Beer I, Patoka R, Ziv T, Kessler O, Tzehoval E, Eisenbach L, Zavazava N, Admon A (2002) Analysis of endogenous peptides bound by soluble MHC class I molecules: a novel approach for identifying tumor-specific antigens. Eur J Immunol 32: 213–222 - PubMed
    1. Baron C, Somogyi R, Greller LD, Rineau V, Wilkinson P, Cho CR, Cameron MJ, Kelvin DJ, Chagnon P, Roy DC, Busque L, Sékaly RP, Perreault C (2007) Prediction of graft-versus-host disease in humans by donor gene expression profiling. PLoS Med 4: e23. - PMC - PubMed
    1. Benoist C, Germain RN, Mathis D (2006) A plaidoyer for ‘systems immunology’. Immunol Rev 210: 229–234 - PubMed
    1. Boehm T (2006) Quality control in self/nonself discrimination. Cell 125: 845–858 - PubMed

Publication types

MeSH terms