. 2011 Sep 27:2:485.
doi: 10.1038/ncomms1491.

The collagen-binding protein of Streptococcus mutans is involved in haemorrhagic stroke

Affiliations
Free PMC article

The collagen-binding protein of Streptococcus mutans is involved in haemorrhagic stroke

Kazuhiko Nakano et al. Nat Commun. .
Free PMC article

Abstract

Although several risk factors for stroke have been identified, one-third remain unexplained. Here we show that infection with Streptococcus mutans expressing collagen-binding protein (CBP) is a potential risk factor for haemorrhagic stroke. Infection with serotype k S. mutans, but not a standard strain, aggravates cerebral haemorrhage in mice. Serotype k S. mutans accumulates in the damaged, but not the contralateral hemisphere, indicating an interaction of bacteria with injured blood vessels. The most important factor for high-virulence is expression of CBP, which is a common property of most serotype k strains. The detection frequency of CBP-expressing S. mutans in haemorrhagic stroke patients is significantly higher than in control subjects. Strains isolated from haemorrhagic stroke patients aggravate haemorrhage in a mouse model, indicating that they are haemorrhagic stroke-associated. Administration of recombinant CBP causes aggravation of haemorrhage. Our data suggest that CBP of S. mutans is directly involved in haemorrhagic stroke.


Figures

Figure 1
Figure 1. Evaluation of the virulence of serotype k S. mutans strains using the mouse cerebral haemorrhage model.
(a) Schematic illustrations of the hypothesis and experimental procedures for S. mutans-induced aggravation of cerebral haemorrhage. (b) Schedule of experimental procedures for photochemically induced endothelial cell injury of the middle cerebral artery in mice. (c) Representative macroscopic appearance of whole mouse brain 24 h after the onset of cerebral haemorrhage administered phosphate buffered saline (PBS, vehicle control) or the TW295 strain of S. mutans. Ips; ipsilateral, Ctr; contralateral hemisphere of brain, respectively. Scale bar; 5 mm. (d) Representative macroscopic appearance of slices of mouse brain administered PBS (control) or the TW295 strain of S. mutans. Arrowheads indicate the haemorrhaged areas. Scale bar; 5 mm. (e) Size of the haemorrhage areas of the group of mice infected with various strains of S. mutans. Each column represents mean±standard error (s.e.m.) from 10–21 independent experiments. Statistical significance was determined using Bonferroni's method after ANOVA. *P<0.05; **P<0.01 versus control. (f) Typical microscopic photographs of ipsilateral hemisphere isolated from control or TW295-administered mice 3 h after the onset of cerebral haemorrhage. Large magnification shows microvascular bleeding. Scale bar; 200 μm. (g) Activation of MMP-9 in mouse brain by gelatin gel zymography. Samples were collected 24 h after the administration of bacteria. Std; standard of MMP-9 (92 kDa) and MMP-2 (62 and 66 kDa).
Figure 2
Figure 2. Accumulation of administered bacteria in damaged ipsilateral area of mouse brain.
(a) Detection of the infected bacterial cells in various kinds of organs by PCR. M; Molecular marker (100-bp ladder, bold bands are 1,000 bp and 500 bp, respectively), Std; Positive control of the genomic DNA extracted from TW295. Ips; ipsilateral, Ctr; contralateral hemisphere of brain, respectively. (b) Recovered isolation of administered bacteria in damaged or non-damaged area. Samples isolated from damaged or non-damaged area in brains were plated onto culture dish for collecting of S. mutans. Recovered isolation numbers of bacteria are expressed as CFU per mg protein. Each column represents mean value from three independent animals. (c) Detection of accumulated bacteria in damaged brain areas by Gram-stain. White arrowheads indicate the accumulated bacteria. Scale bar; 25 μm. (d) Representative appearance of the interaction of the injured blood vessel and infected bacterial cells observed by in vivo SEM. Scale bar; 10 μm. The right photo shows high magnification. White arrowheads show the accumulated bacteria leaked outside of the vessel at the injured site. Scale bar; 5 μm. (e) Interaction of bacteria and collagen fibres around the vessels in a damaged hemisphere by in vivo SEM. White arrowheads indicate bacteria interacting with collagen fibres. Scale bar; 2 μm.
Figure 3
Figure 3. Relationship between collagen-binding activity and cerebral haemorrhage.
(a) Collagen-binding activity of various strains of S. mutans. The activity was evaluated under fixed conditions of 2 mg of Type I collagen and 1×10¹⁰ bacterial cells. The results for each strain are expressed as a percentage of TW871 (defined as 100%). Each column represents mean±standard deviation (s.d.) from three independent experiments. (b) Platelet aggregation activity of various strains of S. mutans. The assays were performed using whole blood obtained from mice with an aggregometer under fixed conditions of 4 μg of Type I collagen and 1×10⁷ bacterial cells. The results for each strain are expressed as a percentage based on that with collagen but no bacterial cells as 100%. Each column represents mean±s.d. from 3–5 independent experiments. (c) Size of the haemorrhagic areas of mice infected with TW295, TW295CND (the strain generated from TW295), or MT8148. Each column represents mean±s.e.m. from 11–16 independent experiments Statistical significance was determined using Bonferroni's method after ANOVA. **P<0.01 versus TW295. (d) Correlation between collagen-binding activity and total area of haemorrhage (regression analysis; R2=0.6981). Each point represents mean±s.e.m. from the data of each treatment. (e) Correlation between collagen-binding activity and collagen-induced platelet aggregation (regression analysis; R2=0.6432). Each point represents mean±s.e.m. from the data of each treatment. (f) Collagen-binding activity of various strains of S. aureus. Phillips and Cowan 1 are reported to have high collagen-binding activity in various S. aureus strains. The activity was evaluated under fixed conditions of 2 mg of Type I collagen and 1×10¹⁰ bacterial cells. The results for each strain are expressed as a percentage of TW871 activity as 100%. Each column represents mean±s.d. from 3–5 independent experiments. (g) Size of the haemorrhagic areas of mice infected with the two strains of S. aureus in a mouse stroke model. Each column represents mean±s.e.m. from 6–7 independent experiments. NS; no statistical significance versus control (Bonferroni's method after ANOVA).
Figure 4
Figure 4. Variation of bacterial cell surface conditions and collagen-induced platelet aggregation.
(a) Representative appearance of S. mutans strains and platelet reactions to collagen observed by SEM. After the reaction with collagen, the platelet fraction was collected and observed by SEM. Scale bar; 2 μm. (b) TEM observation of bacterial surfaces. Scale bar; 0.2 μm. (c) Three-dimensional reconstructed images of bacterial surface of MT8148, TW295 and TW295CND. Opaque with a vague appearance of the peptidoglycan layer of TW295 is indicated with arrowheads. Scale bar; 0.1 μm. (d) Zeta-potential values of S. mutans strains. Zeta-potential values of various strains were measured and expressed in mV. Open columns represent oral isolates and closed columns blood isolates. Each column represents the mean value from 3–5 independent experiments. (e) Correlation between platelet aggregation and zeta-potential value (regression analysis; R=0.740, P=0.0011). Each point represents a mean value from each bacterial strain. (f) Comparison of zeta potential values on MT8148, TW295, and TW295CND. Each column represents mean±s.e.m. from 3–5 independent experiments.
Figure 5
Figure 5. Effect of CBP-expressing S. mutans isolated from stroke patients on cerebral haemorrhage.
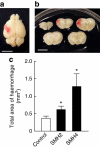
(a) Representative macroscopic appearance of whole mouse brain 24 h after the onset of cerebral haemorrhage administered SMH4 isolated from a haemorrhagic stroke patient. Scale bar; 5 mm. (b) Representative macroscopic appearance of mouse brain slices administered SMH4. Scale bar; 5 mm. (c) Size of the haemorrhage areas from the group of mice infected with CBP-expressing S. mutans (SMH2 and SMH4) isolated from stroke patients. Each column represents mean±s.e.m. from 11–16 independent experiments. Statistical significance was determined using Bonferroni's method after ANOVA. *P<0.05 versus control.
Figure 6
Figure 6. Effect of CBP-expressing S. mutans on SHRSP rats.
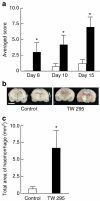
(a) Alteration of neurological deficits on TW295-administered or vehicle-administered SHRSP rats. The neurological deficit score of each animal was evaluated and scored. Open columns represent vehicle-administered control and closed columns represent TW295 administered groups. Each column represents mean±s.e.m. from 8–10 independent experiments. Statistical significance was determined using Student's t-test. *P<0.05 versus control. (b) Representative macroscopic appearance of SHRSP rat brain slices administered TW295 (TW295) or vehicle (Control). Scale bar; 5 mm. (c) Total size of the haemorrhage areas of the group of SHRSP rats injected with TW295 or vehicle (control). Each column represents mean±s.e.m. from 8–10 independent experiments. Statistical significance was determined using Student's t-test. *P<0.05 versus control.
Figure 7
Figure 7. Effect of recombinant Cnm protein administration in a mouse cerebral haemorrhage model.
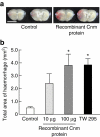
(a) Macroscopic appearance of representative mouse brain slices administered recombinant Cnm protein or vehicle (Control). Scale bar; 5 mm. (b) Total size of the haemorrhage areas of the mice administered recombinant Cnm protein (10 and 100 μg per animal), TW295 bacterial cells (TW295), or vehicle (Control). Each column represents mean±s.e.m. from 10–12 independent experiments. Statistical significance was determined using Bonferroni's method after ANOVA. *P<0.05 versus control.

References

    1. Murray C. J. & Lopez A. D. Mortality by cause for eight regions of the world: global burden of disease study. Lancet 349, 1269–1276 (1997). - PubMed
    1. Donnan G. A., Fisher M., Macleod M. & Davis S. M. Stroke. Lancet 371, 1612–1623 (2008). - PubMed
    1. Broderick J. et al.. Guidelines for the management of spontaneous intracerebral hemorrhage in adults: 2007 update: A guideline from the American Heart Association, American Stroke Association Stroke Council, High Blood Pressure Research Council, and the Quality of Care and Outcomes in Research Interdisciplinary Working Group. Stroke 38, 2001–2023 (2007). - PubMed
    1. Woo D. et al.. Genetic and environmental risk factors for intracerebral hemorrhage: preliminary results of a population-based study. Stroke 33, 1190–1195 (2002). - PubMed
    1. Emsley H. C. & Tyrrell P. J. Inflammation and infection in clinical stroke. J. Cereb. Blood Flow Metab. 22, 1399–1419 (2002). - PubMed

Publication types