

Beverage consumption among European adolescents in the HELENA study
- PMID: 21952695
- PMCID: PMC3392586
- DOI: 10.1038/ejcn.2011.166
Beverage consumption among European adolescents in the HELENA study
Abstract
Background/objectives: Our objective was to describe the fluid and energy consumption of beverages in a large sample of European adolescents.
Subjects/methods: We used data from 2741 European adolescents residing in 8 countries participating in the Healthy Lifestyle in Europe by Nutrition in Adolescence Cross-Sectional Study (HELENA-CSS). We averaged two 24-h recalls, collected using the HELENA-dietary assessment tool. By gender and age subgroup (12.5-14.9 years and 15-17.5 years), we examined per capita and per consumer fluid (milliliters (ml)) and energy (kilojoules (kJ)) intake from beverages and percentage consuming 10 different beverage groups.
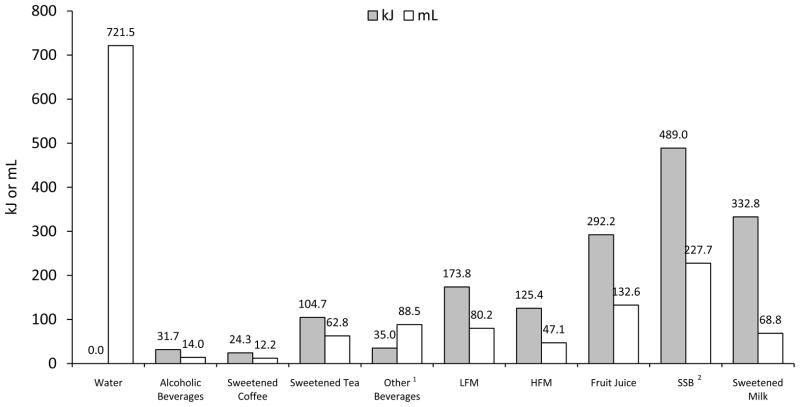
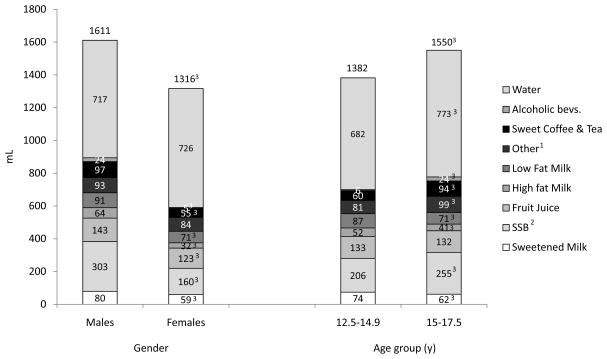
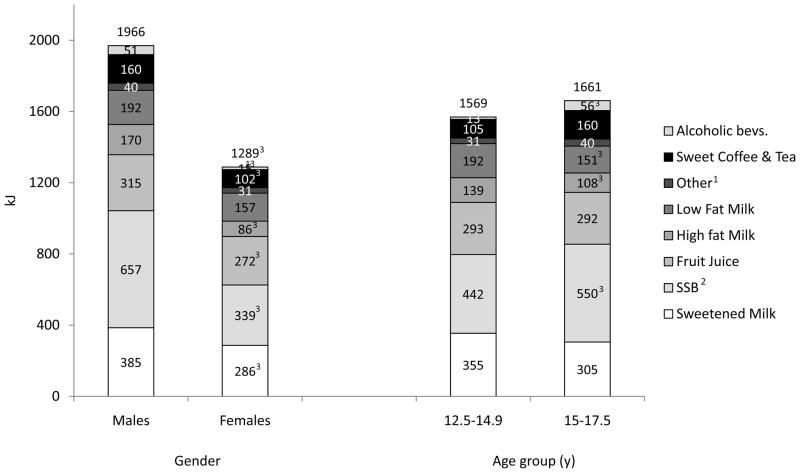
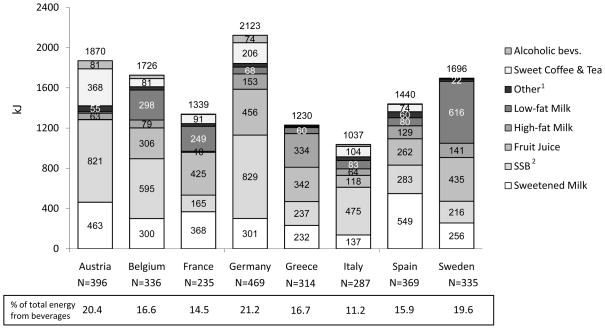
Results: Mean beverage consumption was 1611 ml/day in boys and 1316 ml/day in girls. Energy intake from beverages was about 1966 kJ/day and 1289 kJ/day in European boys and girls, respectively, with sugar-sweetened beverages (SSBs) (carbonated and non-carbonated beverages, including soft drinks, fruit drinks and powders/concentrates) contributing to daily energy intake more than other groups of beverages. Boys and older adolescents consumed the most amount of per capita total energy from beverages. Among all age and gender subgroups, SSBs, sweetened milk (including chocolate milk and flavored yogurt drinks all with added sugar), low-fat milk and fruit juice provided the highest amount of per capita energy. Water was consumed by the largest percentage of adolescents followed by SSBs, fruit juice and sweetened milk. Among consumers, water provided the greatest fluid intake and sweetened milk accounted for the largest amount of energy intake followed by SSBs. Patterns of energy intake from each beverage varied between countries.
Conclusions: European adolescents consume an average of 1455 ml/day of beverages, with the largest proportion of consumers and the largest fluid amount coming from water. Beverages provide 1609 kJ/day, of which 30.4%, 20.7% and 18.1% comes from SSBs, sweetened milk and fruit juice, respectively.
Conflict of interest statement
The authors declare no conflict of interest.
Figures
References
-
- Andersen LF, I, Lillegaard T, et al. Overweight and obesity among Norwegian schoolchildren: changes from 1993 to 2000. Scand J Public Health. 2005;33(2):99–106. - PubMed
-
- Armstrong LE. Hydration assessment techniques. Nutr Rev. 2005;63(6 Pt 2):S40–54. - PubMed
-
- Beghin L, Castera M, et al. Quality assurance of ethical issues and regulatory aspects relating to good clinical practices in the HELENA Cross-Sectional Study. Int J Obes (Lond) 2008;32(Suppl 5):S12–18. - PubMed
-
- Bleich SN, Wang YC, et al. Increasing consumption of sugar-sweetened beverages among US adults: 1988–1994 to 1999–2004. Am J Clin Nutr. 2009;89(1):372–381. - PubMed
Publication types
MeSH terms
Substances
Grants and funding
LinkOut - more resources
Full Text Sources
