. 2011 Dec;225(4):479-89.
doi: 10.1002/path.2971. Epub 2011 Sep 26.

Gain-of-function mutant p53 but not p53 deletion promotes head and neck cancer progression in response to oncogenic K-ras

Affiliations

Gain-of-function mutant p53 but not p53 deletion promotes head and neck cancer progression in response to oncogenic K-ras

Sergio Acin et al. J Pathol. 2011 Dec.

Abstract

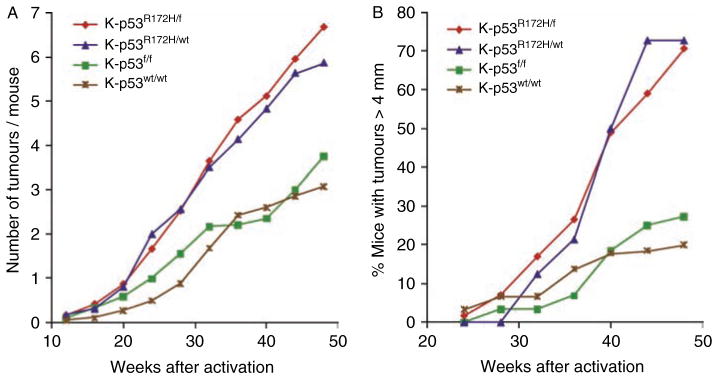
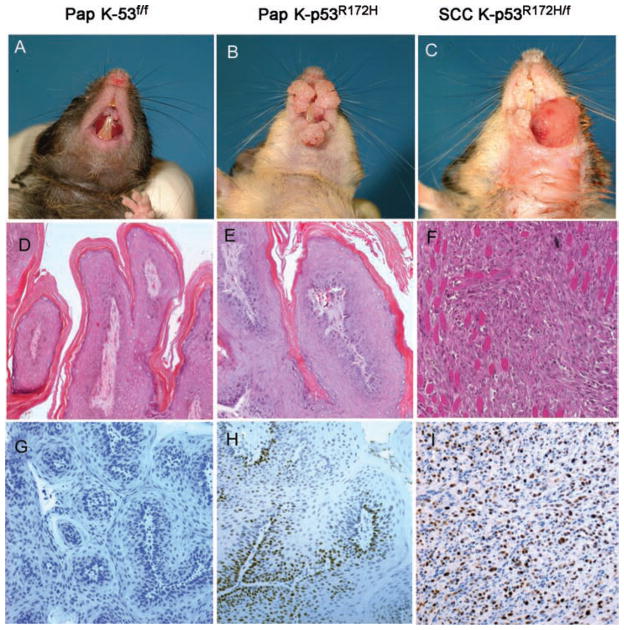
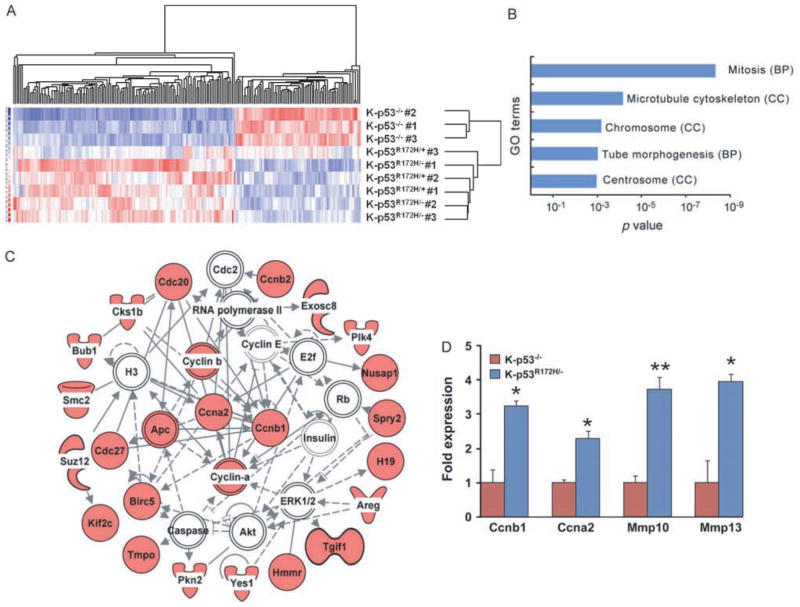
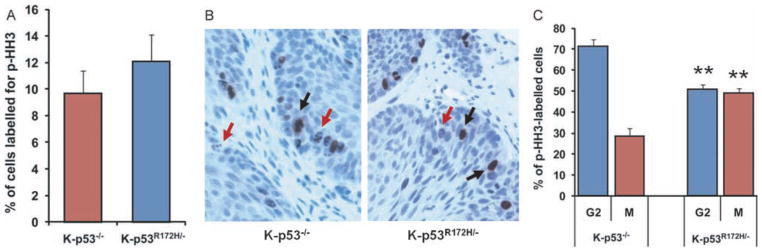
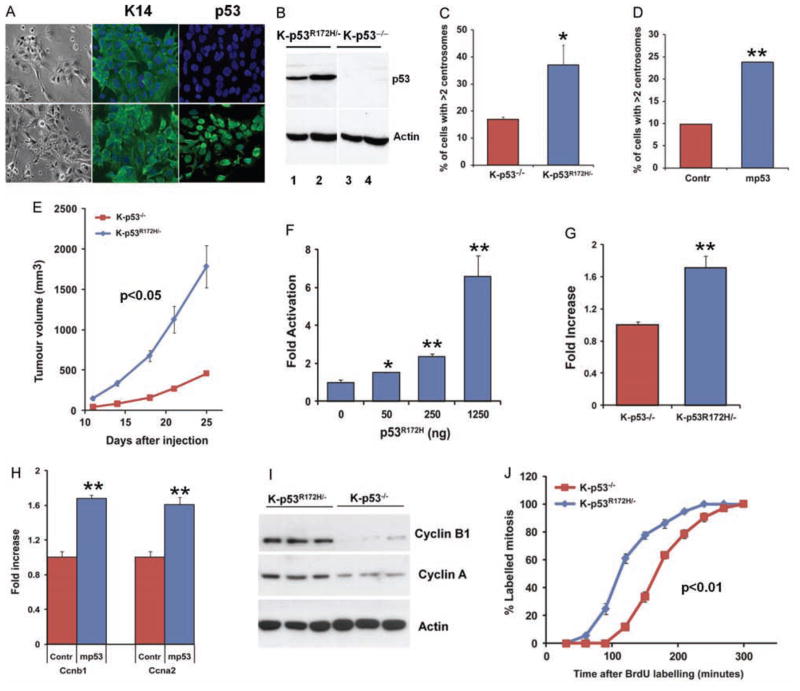
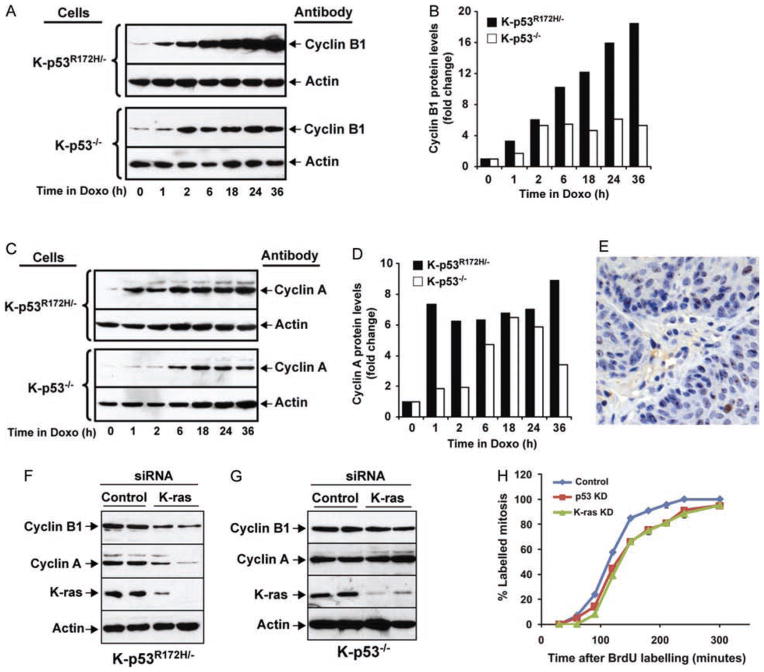
Mutations in p53 occur in over 50% of the human head and neck squamous cell carcinomas (SCCHN). The majority of these mutations result in the expression of mutant forms of p53, rather than deletions in the p53 gene. Some p53 mutants are associated with poor prognosis in SCCHN patients. However, the molecular mechanisms that determine the poor outcome of cancers carrying p53 mutations are unknown. Here, we generated a mouse model for SCCHN and found that activation of the endogenous p53 gain-of-function mutation p53$^{\rm{R172H}}$, but not deletion of p53, cooperates with oncogenic K-ras during SCCHN initiation, accelerates oral tumour growth, and promotes progression to carcinoma. Mechanistically, expression profiling of the tumours that developed in these mice and studies using cell lines derived from these tumours determined that mutant p53 induces the expression of genes involved in mitosis, including cyclin B1 and cyclin A, and accelerates entry in mitosis. Additionally, we discovered that this oncogenic function of mutant p53 was dependent on K-ras because the expression of cyclin B1 and cyclin A decreased, and entry in mitosis was delayed, after suppressing K-ras expression in oral tumour cells that express p53$^{\rm{R172H}}$. The presence of double-strand breaks in the tumours suggests that oncogene-dependent DNA damage resulting from K-ras activation promotes the oncogenic function of mutant p53. Accordingly, DNA damage induced by doxorubicin also induced increased expression of cyclin B1 and cyclin A in cells that express p53$^{\rm{R172H}}$. These findings represent strong in vivo evidence for an oncogenic function of endogenous p53 gain-of-function mutations in SCCHN and provide a mechanistic explanation for the genetic interaction between oncogenic K-ras and mutant p53.


Conflict of interest statement

No conflicts of interest were declared.

Figures

Figure 1
Figure 1
Kinetics of oral tumour formation and growth. (A) Kinetics of oral tumour formation in mice carrying different combinations of p53 alleles: K-p53R172H/f mice (red line, n = 62), K-p53R172H/wt mice (blue line, n = 17), K-p53f/f mice (green line, n = 30), and K-p53wt/wt mice (brown line, n = 18). Tumour initiation was determined by the average number of tumours that developed per mouse after Cre activation induced by topical application of RU486 in the oral cavity. (B) Kinetics of tumour growth in mice described in panel A. Each time point represents the percentage of mice with tumours larger than 4 mm.
Figure 2
Figure 2
Histopathology of the mouse oral tumours. (A, B) Gross appearance of papillomas (Pap) that developed in the oral cavity of (A) K-p53f/f mice or (B) K-p53R172H/f mice, 8 months after activation of the conditional alleles. (C) Frontal view showing the gross appearance of a carcinoma (SCC) that developed in a K-p53R172H/f mouse. (D–F) Haematoxylin and eosin staining of oral papillomas that developed in (D) K-p53f/f mice or (E) K-p53R172H/f mice, and (F) the carcinoma shown in panel C. (G–I) Immunohistochemistry for p53 in oral papillomas that developed in (G) K-p53f/f mice and (H) papillomas or (I) carcinomas that developed in K-p53R172H/f mice.
Figure 3
Figure 3
Gene expression analysis of p53 mutant oral tumours. (A) Hierarchical clustering of oral tumour samples using a gene list containing genes with differential expression in oral tumours that expressed p53R172H (K-p53R172H/− and K-p53R172H/+ tumours) compared with tumours that lacked p53 (K-p53−/− tumours). Three tumours per genotype were analysed. (B) Gene ontology terms enriched in genes up-regulated in tumours that expressed p53R172H. Each bar represents a distinct term, indicating in parentheses the gene ontology category: biological process (BP) or cell component (CC). (C) Gene network generated with IPA using genes up-regulated in p53R172H tumours. Icons in red represent genes with increased expression in p53R172H tumours; white icons represent genes with unchanged expression. The highest connected nodes were moved to the centre of the network and other genes were brought to the periphery. Note that cyclin B1 (Ccnb1) and cyclin A (Ccna2) are the most connected genes in this network. (D) Real-time RT-PCR for the indicated genes. Three tumours per genotype were analysed in triplicate. *p = 0.01–0.05; **p < 0.01.
Figure 4
Figure 4
Quantification of mitosis in oral tumours. (A) Percentage of cells labelled with an antibody for pHH3 in tumours with the indicated genotypes. Five tumours per genotype were analysed and over 400 cells per tumour were counted. (B) Immunohistochemistry for pHH3 in K-p53−/− tumours (left panel) and K-p53R172H/− tumours (right panel). Note the distinctive punctate staining (red arrows) and solid staining (black arrows) in the tumours. (C) Cells in G2 (punctate staining for pHH3) and in mitosis (solid staining for pHH3) were counted and are represented as a percentage of all pHH3-positive cells. Five tumours per genotype were analysed. **p < 0.01.
Figure 5
Figure 5
Cyclin B1 expression and accelerated entry in mitosis induced by mutant p53 in cell lines derived from mouse oral tumours. (A) Bright field images illustrating the epithelial morphology of the cells (left panels), and immunofluorescence staining showing the organization of keratin 14 (K14) filaments in K-p53−/− (top panels) and K-p53R172H/− cell lines (bottom panels), and p53 accumulation in the nuclei of K-p53R172H/− cells, but not in K-p53−/− cells. (B) Western blot for p53 in K-p53R172H/− and K-p53−/− cell lines. Two independent cell lines from each genotype are shown. (C) Centrosomes were visualized by immunofluorescence staining with a γ-tubulin antibody. The number of cells with more than two centrosomes is represented. Three independent cell lines per genotype were analysed. (D) Transfection of mutant p53 into K-p53−/− oral tumour cells using the p53R172H minigene (mp53) induces centrosome amplification. Centrosomes were scored as indicated in panel C. (E) Tumour growth induced upon subcutaneous injection of K-p53R172H/− and K-p53−/− cell lines in athymic nude mice. 106 cells per cell line were injected. Three cell lines of each genotype were analysed. (F) Luciferase reporter assay showing that transfection of K-p53−/− oral tumour cells with increasing concentrations of a plasmid carrying a p53R172H minigene results in increased activity of the cyclin B1 promoter. (G) Luciferase reporter assay for the cyclin B1 promoter in K-p53−/− and K-p53R172H/− cell lines. Data are expressed as mean of triplicates. (H) Real-time RT-PCR for Ccnb1 (cyclin B1) and Ccna2 (cyclin A) using RNA purified from K-p53−/− oral tumour cells transfected with a control empty plasmid (Contr) or a plasmid carrying a p53R172H minigene (mp53). (I) Protein expression of cyclin B1 and cyclin A in K-p53R172H/− and K-p53−/− cell lines. Three independent cell lines per genotype were analysed. (J) Percentage of BrdU-labelled mitosis at different times after BrdU labelling. To identify cells in mitosis, cells pulsed with BrdU were stained for pHH3 at different times after chasing BrdU labelling. The rate of entry in mitosis was determined by analysing the ratio of BrdU-labelled mitosis. Two cell lines per genotype were analysed and over 100 cells per time point were counted in each cell line. *p = 0.01–0.05; **p < 0.01.
Figure 6
Figure 6
Induction of cyclin B1 and cyclin A in response to DNA damage and K-ras. (A) Western blot analysis of cellular extracts from K-p53R172H/− and K-p53−/− cells treated with 200 ng/ml doxorubicin for up to 36 h, using cyclin B1 and β-actin antibodies. (B) Protein levels in panel A are represented as fold increase relative to time 0, after normalization with β-actin, used as a loading control. (C) Analysis of cyclin A protein levels using the cell lysates described in panel A. (D) Quantification of the cyclin A protein levels shown in panel C, normalized with β-actin. (E) Immunohistochemistry for γ-H2AX in a K-p53wt/wt oral tumour. (F) Suppression of K-ras expression in K-p53R172H/− cells. Control or K-ras siRNAs were transfected into K-p53R172H/− cells, and the expression of cyclin B1, cyclin A, and K-ras was analysed by western blot. Quantification of cyclin B1 and cyclin A levels is shown in the Supporting information, Supplementary Figures 2A and 2B. (G) Suppression of K-ras expression in K-p53−/− cells. Control or K-ras siRNAs were transfected into K-p53−/− cells, and the expression of cyclin B1 and cyclin A was analysed by western blot. Quantification of cyclin B1 and cyclin A levels is shown in the Supporting information, Supplementary Figures 2C and 2D. (H) Suppression of K-ras and mutant p53 expression delays entry in mitosis in cells that express p53R172H. Percentage of labelled mitosis was determined as in Figure 5J in cells transfected with a control siRNA (blue line), K-ras siRNA (green line) or p53 siRNA (red line). Duplicates for each time point are represented and over 100 cells per time point were counted. p < 0.01 for both K-ras siRNA and p53 siRNA compared with control siRNA.

Comment in

References

    1. Ferlay J, Shin HR, Bray F, et al. Estimates of worldwide burden of cancer in 2008: GLOBOCAN 2008. Int J Cancer. 2010;127:2893–2917. - PubMed
    1. Seiwert TY, Salama JK, Vokes EE. The chemoradiation paradigm in head and neck cancer. Nature Clin Pract Oncol. 2007;4:156–171. - PubMed
    1. Vokes EE, Weichselbaum RR, Lippman SM, et al. Head and neck cancer. N Engl J Med. 1993;328:184–194. - PubMed
    1. Culliney B, Birhan A, Young AV, et al. Management of locally advanced or unresectable head and neck cancer. Oncology (Williston Park) 2008;22:1152–1161. - PubMed
    1. Califano J, van der Riet P, Westra W, et al. Genetic progression model for head and neck cancer: implications for field cancerization. Cancer Res. 1996;56:2488–2492. - PubMed

Publication types