Controlled Clinical Trial
. 2011 Nov;60(11):3006-14.
doi: 10.2337/db11-0589. Epub 2011 Sep 27.

Prospectively determined impact of type 1 diabetes on brain volume during development

Affiliations
Controlled Clinical Trial

Prospectively determined impact of type 1 diabetes on brain volume during development

Dana C Perantie et al. Diabetes. 2011 Nov.

Abstract

Objective: The impact of type 1 diabetes mellitus (T1DM) on the developing central nervous system is not well understood. Cross-sectional, retrospective studies suggest that exposure to glycemic extremes during development is harmful to brain structure in youth with T1DM. However, these studies cannot identify brain regions that change differentially over time depending on the degree of exposure to glycemic extremes.

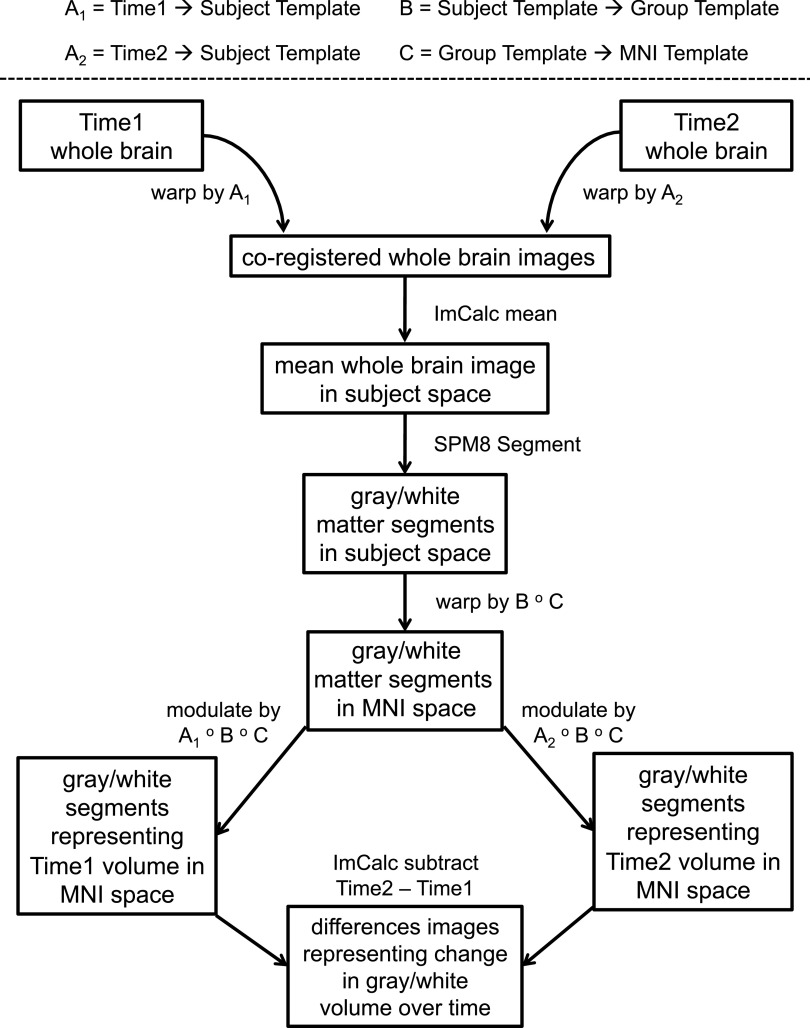
Research design and methods: We performed a longitudinal, prospective structural neuroimaging study of youth with T1DM (n = 75; mean age = 12.5 years) and their nondiabetic siblings (n = 25; mean age = 12.5 years). Each participant was scanned twice, separated by 2 years. Blood glucose control measurements (HbA(1c), glucose meter results, and reports of severe hypoglycemia) were acquired during the 2-year follow-up. Sophisticated image registration algorithms were performed, followed by whole brain and voxel-wise statistical analyses of the change in gray and white matter volume, controlling for age, sex, and age of diabetes onset.

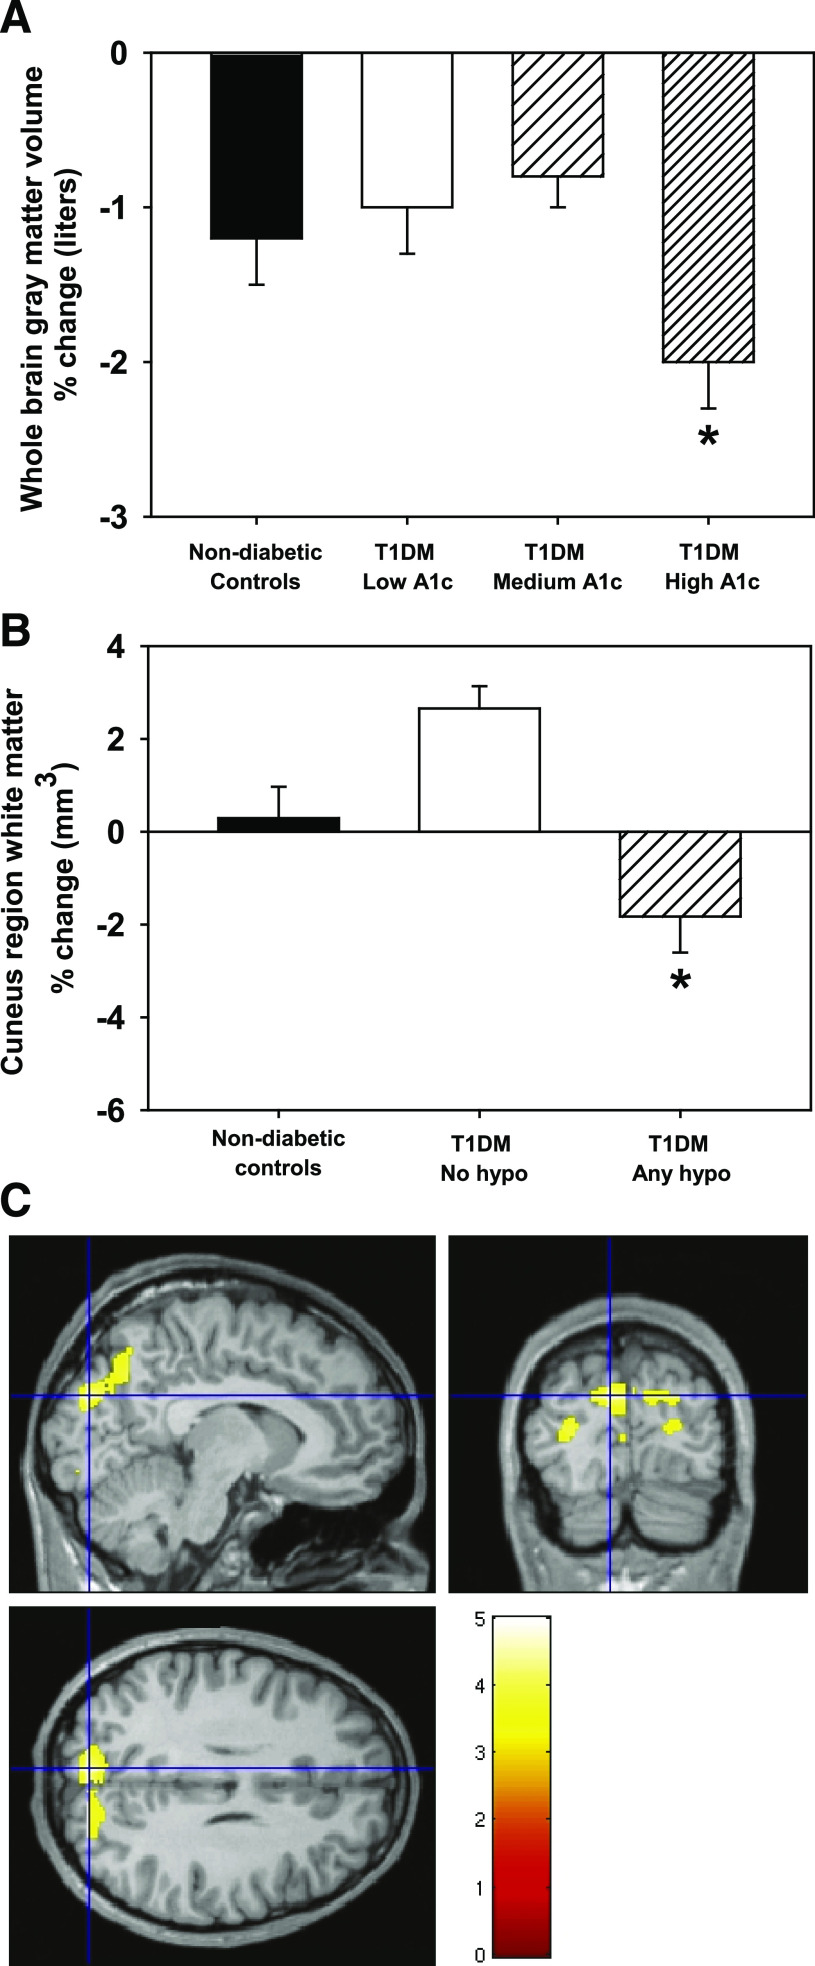
Results: The T1DM and nondiabetic control (NDC) sibling groups did not differ in whole brain or voxel-wise change over the 2-year follow-up. However, within the T1DM group, participants with more hyperglycemia had a greater decrease in whole brain gray matter compared with those with less hyperglycemia (P < 0.05). Participants who experienced severe hypoglycemia had greater decreases in occipital/parietal white matter volume compared with those with no severe hypoglycemia (P < 0.05) and compared with the NDC sibling group (P < 0.05).

Conclusions: These results demonstrate that within diabetes, exposure to hyperglycemia and severe hypoglycemia may result in subtle deviation from normal developmental trajectories of the brain.

Trial registration: ClinicalTrials.gov NCT00879203.


Figures

FIG. 1.
FIG. 1.
Process by which images were prepared for analysis: 1) Unified segment and bias-correction. Images were segmented into gray matter, white matter, and cerebrospinal fluid, and field inhomogeneity-corrected images were produced with SPM8’s “unified segment” module (49). From the next step forward, image preparation steps were performed on gray and white matter segmented images separately. 2) DARTEL import. Gray and white matter segmented images were imported into Diffeomorphic Anatomical Registration Through Exponentiated Lie Algebra (DARTEL), a component of SPM8 that determines an average-shaped template from all provided images and calculates high dimensional spatial flow fields between each image and the template (30). During import, images were rigidly aligned and resampled to 1.5 mm cubic voxels. 3) Within-subject DARTEL. For each subject, DARTEL was used to calculate flow fields between Time 1 and Time 2 segmented images and a subject-specific gray or white matter template, which can be considered an image halfway between Time 1 and Time 2. We refer to the within-subject flow fields as “A1” for the warp between Time 1 and subject template and “A2” as the warp between Time 2 and subject template. 4) Between-subject DARTEL. DARTEL was used to calculate flow fields from each subject template to a simultaneously calculated group template, an image representing all 100 subjects. We refer to the warp parameters between subject template and group template as “B.” 5) A 12-parameter affine transformation from the group template to Montreal Neurologic Institute (MNI) template was calculated for ease of interpretation of coordinate results. We refer to the affine transform from group template to MNI space as “C.” 6) Within-subject flow fields (A1 and A2) were applied, respectively, to inhomogeneity-corrected whole brain Time 1 and Time 2 images (produced in Step 1). We averaged the nonzero voxels of the resulting coregistered pair of images. 7) Each subject’s mean image was segmented into gray matter and white matter tissue with SPM8’s unified segment module. 8) A composition of warps from subject template space to MNI space was calculated with SPM’s deformations utility: [subject template to group template] o [group template to MNI], or [B o C]. Composing warps so that they may be applied simultaneously prevents errors that would be introduced by resampling the images multiple times. 9) Composed warps [B o C] were applied to the gray and white matter images produced in Step 7, resulting in segmented images in MNI space. Since the spatial normalization information from subject to MNI space came from the subject-specific template, each time point contributed to the normalization, avoiding potential bias caused by applying normalization parameters of a single time point to both time points. 10) A composition of warps from each time point to MNI space was calculated with the deformations utility: [A1 o B o C] and [A2 o B o C]. 11) The MNI-registered segments were then “modulated” by (multiplied by the Jacobian determinant of) the warps from step 10 to preserve quantitative volume. The influence of independent normalization of each time point was minimized by applying Time 1 and Time 2 Jacobian determinants to the same segments. This resulted in MNI-registered Time 1 and Time 2 gray and white matter segmented images whose intensities correspond to units of volume. 12) MNI-registered Time 1 and Time 2 images were smoothed with a Gaussian kernel 8-mm full-width at half-maximum. 13) Time 1 segment images were subtracted from Time 2 segment images to create images representing change in gray or white matter volume over time. These different images were entered into statistical models to relate brain volume changes over time to variables of interest such as hypoglycemia and hyperglycemia exposure. ImCalc, image calculator.
FIG. 2.
FIG. 2.
A: Mean ± SEM percent change in whole brain gray matter across hyperglycemia subgroups and NDCs. *Different from other HbA1c groups (P < 0.05) and marginally different from NDC (P = 0.06). B: Occipital/parietal white matter across severe hypoglycemia subgroups and NDCs. *Different from other groups (P < 0.05). C: Statistical image showing occipital/parietal region where T1DM with any hypoglycemia differ from T1DM with no hypoglycemia. Hypo, hypoglycemia. (A high-quality digital representation of this figure is available in the online issue.)

References

    1. Olsen BS, Sjølie A, Hougaard P, et al. . A 6-year nationwide cohort study of glycaemic control in young people with type 1 diabetes. Risk markers for the development of retinopathy, nephropathy and neuropathy. J Diabetes Complications 2000;14:295–300 - PubMed
    1. Chkhartishvili D, Khachapuridze N, Natriashvili G, Geladze N, Kapanadze N. Nerve conduction abnormalities in children with type I diabetes. Annals of Biomedical Research and Education 2002;2:331–334
    1. Riihimaa PH, Suominen K, Tolonen U, Jäntti V, Knip M, Tapanainen P. Peripheral nerve function is increasingly impaired during puberty in adolescents with type 1 diabetes. Diabetes Care 2001;24:1087–1092 - PubMed
    1. Northam EA, Rankins D, Lin A, et al. . Central nervous system function in youth with type 1 diabetes 12 years after disease onset. Diabetes Care 2009;32:445–450 - PMC - PubMed
    1. Perantie DC, Wu J, Koller JM, et al. . Regional brain volume differences associated with hyperglycemia and severe hypoglycemia in youth with type 1 diabetes. Diabetes Care 2007;30:2331–2337 - PubMed

Publication types

MeSH terms

Substances

Associated data