

Myocardial T1 mapping with MRI: comparison of look-locker and MOLLI sequences
- PMID: 21954119
- PMCID: PMC3221792
- DOI: 10.1002/jmri.22753
Myocardial T1 mapping with MRI: comparison of look-locker and MOLLI sequences
Abstract
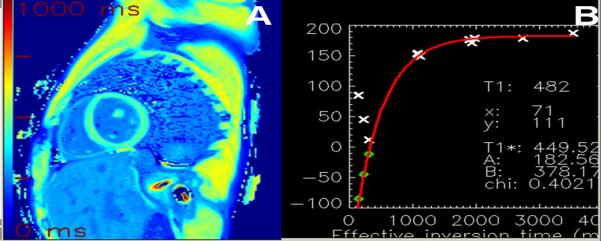
Purpose: To evaluate the relationship between "Look-Locker" (LL) and modified Look-Locker Inversion recovery (MOLLI) approaches for T1 mapping of the myocardium.
Materials and methods: A total of 168 myocardial T1 maps using MOLLI and 165 maps using LL were obtained in human subjects at 1.5 Tesla. The T1 values of the myocardium were calculated before and at five time points after gadolinium administration. All time and heart rate normalizations were done. The T1 values obtained were compared to determine the absolute and bias agreement.
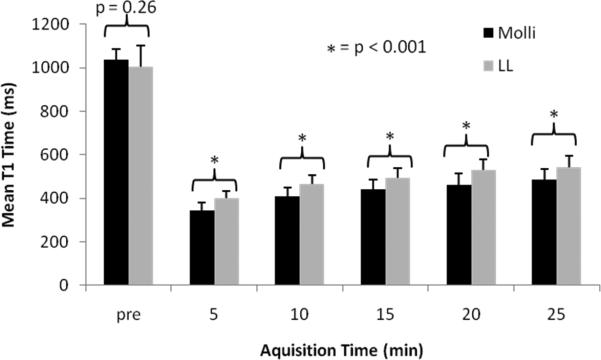
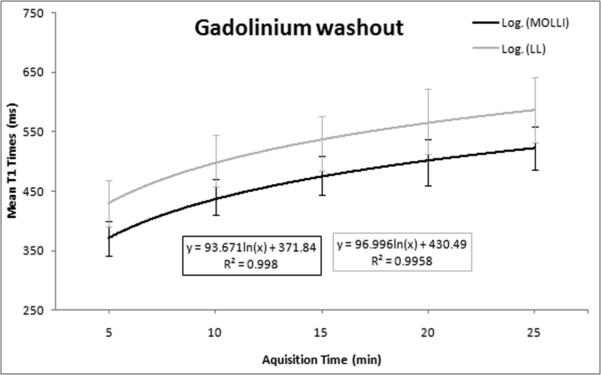
Results: The precontrast global T1 values were similar when measured by the LL and by MOLLI technique (mean, 1004.9 ms ± 120.3 versus 1034.1 ms ± 53.1, respectively, P = 0.26). Postcontrast myocardial T1 time from LL was significantly longer than MOLLI from 5 to 25 min (mean difference, LL - MOLLI was +61.8 ± 46.4 ms, P < 0.001). No significant differences in T1 values were noted between long and short axis measurements for either MOLLI or LL.
Conclusion: Postcontrast LL and MOLLI showed very good agreement, although LL values are higher than MOLLI. Precontrast T1 values showed good agreement, however LL has greater limits of agreement. Short and long axis planes can reliably assess T1 values.
Copyright © 2011 Wiley Periodicals, Inc.
Figures


References
-
- Messroghli DR, Walters K, Plein S, et al. Myocardial T1 mapping: application to patients with acute and chronic myocardial infarction. Magn Reson Med. 2007;58(1):34–40. - PubMed
-
- Messroghli DR, Niendorf T, Schulz-Menger J, Dietz R, Friedrich MG. T1 mapping in patients with acute myocardial infarction. J Cardiovasc Magn Reson. 2003;5(2):353–359. - PubMed
-
- Sparrow P, Messroghli DR, Reid S, Ridgway JP, Bainbridge G, Sivananthan MU. Myocardial T1 mapping for detection of left ventricular myocardial fibrosis in chronic aortic regurgitation: pilot study. AJR Am J Roentgenol. 2006;187(6):W630–635. - PubMed
-
- Iles L, Pfluger H, Phrommintikul A, et al. Evaluation of diffuse myocardial fibrosis in heart failure with cardiac magnetic resonance contrast-enhanced T1 mapping. J Am Coll Cardiol. 2008;52(19):1574–1580. - PubMed
Publication types
MeSH terms
Substances
Grants and funding
LinkOut - more resources
Full Text Sources
Other Literature Sources
Medical
