Yeast Nrd1, Nab3, and Sen1 transcriptome-wide binding maps suggest multiple roles in post-transcriptional RNA processing
- PMID: 21954178
- PMCID: PMC3198594
- DOI: 10.1261/rna.2840711
Yeast Nrd1, Nab3, and Sen1 transcriptome-wide binding maps suggest multiple roles in post-transcriptional RNA processing
Abstract
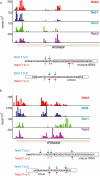
RNA polymerase II transcribes both coding and noncoding genes, and termination of these different classes of transcripts is facilitated by different sets of termination factors. Pre-mRNAs are terminated through a process that is coupled to the cleavage/polyadenylation machinery, and noncoding RNAs in the yeast Saccharomyces cerevisiae are terminated through a pathway directed by the RNA-binding proteins Nrd1, Nab3, and the RNA helicase Sen1. We have used an in vivo cross-linking approach to map the binding sites of components of the yeast non-poly(A) termination pathway. We show here that Nrd1, Nab3, and Sen1 bind to a number of noncoding RNAs in an unexpected manner. Sen1 shows a preference for H/ACA over box C/D snoRNAs. Nrd1, which binds to snoRNA terminators, also binds to the upstream region of some snoRNA transcripts and to snoRNAs embedded in introns. We present results showing that several RNAs, including the telomerase RNA TLC1, require Nrd1 for proper processing. Binding of Nrd1 to transcripts from tRNA genes is another unexpected observation. We also observe RNA polymerase II binding to transcripts from RNA polymerase III genes, indicating a possible role for the Nrd1 pathway in surveillance of transcripts synthesized by the wrong polymerase. The binding targets of Nrd1 pathway components change in the absence of glucose, with Nrd1 and Nab3 showing a preference for binding to sites in the mature snoRNA and tRNAs. This suggests a novel role for Nrd1 and Nab3 in destruction of ncRNAs in response to nutrient limitation.
Figures




Similar articles
-
Transcriptome-wide binding sites for components of the Saccharomyces cerevisiae non-poly(A) termination pathway: Nrd1, Nab3, and Sen1.PLoS Genet. 2011 Oct;7(10):e1002329. doi: 10.1371/journal.pgen.1002329. Epub 2011 Oct 20. PLoS Genet. 2011. PMID: 22028667 Free PMC article.
-
The exosome component Rrp6 is required for RNA polymerase II termination at specific targets of the Nrd1-Nab3 pathway.PLoS Genet. 2015 Feb 13;11(2):e1004999. doi: 10.1371/journal.pgen.1004999. eCollection 2015. PLoS Genet. 2015. PMID: 25680078 Free PMC article.
-
Interactions of Sen1, Nrd1, and Nab3 with multiple phosphorylated forms of the Rpb1 C-terminal domain in Saccharomyces cerevisiae.Eukaryot Cell. 2012 Apr;11(4):417-29. doi: 10.1128/EC.05320-11. Epub 2012 Jan 27. Eukaryot Cell. 2012. PMID: 22286094 Free PMC article.
-
The Nrd1-Nab3-Sen1 transcription termination complex from a structural perspective.Biochem Soc Trans. 2023 Jun 28;51(3):1257-1269. doi: 10.1042/BST20221418. Biochem Soc Trans. 2023. PMID: 37222282 Free PMC article. Review.
-
Transcription termination and the control of the transcriptome: why, where and how to stop.Nat Rev Mol Cell Biol. 2015 Mar;16(3):190-202. doi: 10.1038/nrm3943. Epub 2015 Feb 4. Nat Rev Mol Cell Biol. 2015. PMID: 25650800 Review.
Cited by
-
Common mechanism of transcription termination at coding and noncoding RNA genes in fission yeast.Nat Commun. 2018 Oct 19;9(1):4364. doi: 10.1038/s41467-018-06546-x. Nat Commun. 2018. PMID: 30341288 Free PMC article.
-
RNA Polymerase II CTD phosphatase Rtr1 fine-tunes transcription termination.PLoS Genet. 2020 Mar 18;16(3):e1008317. doi: 10.1371/journal.pgen.1008317. eCollection 2020 Mar. PLoS Genet. 2020. PMID: 32187185 Free PMC article.
-
Maturation and shuttling of the yeast telomerase RNP: assembling something new using recycled parts.Curr Genet. 2022 Feb;68(1):3-14. doi: 10.1007/s00294-021-01210-2. Epub 2021 Sep 2. Curr Genet. 2022. PMID: 34476547 Free PMC article. Review.
-
Diverse mechanisms for spliceosome-mediated 3' end processing of telomerase RNA.Nat Commun. 2015 Jan 19;6:6104. doi: 10.1038/ncomms7104. Nat Commun. 2015. PMID: 25598145 Free PMC article.
-
The Saccharomyces cerevisiae Nrd1-Nab3 transcription termination pathway acts in opposition to Ras signaling and mediates response to nutrient depletion.Mol Cell Biol. 2012 May;32(10):1762-75. doi: 10.1128/MCB.00050-12. Epub 2012 Mar 19. Mol Cell Biol. 2012. PMID: 22431520 Free PMC article.
References
-
- Anderson JT, Wang X 2009. Nuclear RNA surveillance: no sign of substrates tailing off. Crit Rev Biochem Mol Biol 44: 16–24 - PubMed
-
- Arigo JT, Carroll KL, Ames JM, Corden JL 2006a. Regulation of yeast NRD1 expression by premature transcription termination. Mol Cell 21: 641–651 - PubMed
-
- Arigo JT, Eyler DE, Carroll KL, Corden JL 2006b. Termination of cryptic unstable transcripts is directed by yeast RNA-binding proteins Nrd1 and Nab3. Mol Cell 23: 841–851 - PubMed
Publication types
MeSH terms
Substances
Grants and funding
LinkOut - more resources
Full Text Sources
Molecular Biology Databases
