. 2011 Sep 15:5:65.
doi: 10.3389/fnsys.2011.00065. eCollection 2011.

In search of the structure of human olfactory space

Affiliations

In search of the structure of human olfactory space

Alexei A Koulakov et al. Front Syst Neurosci. .

Abstract

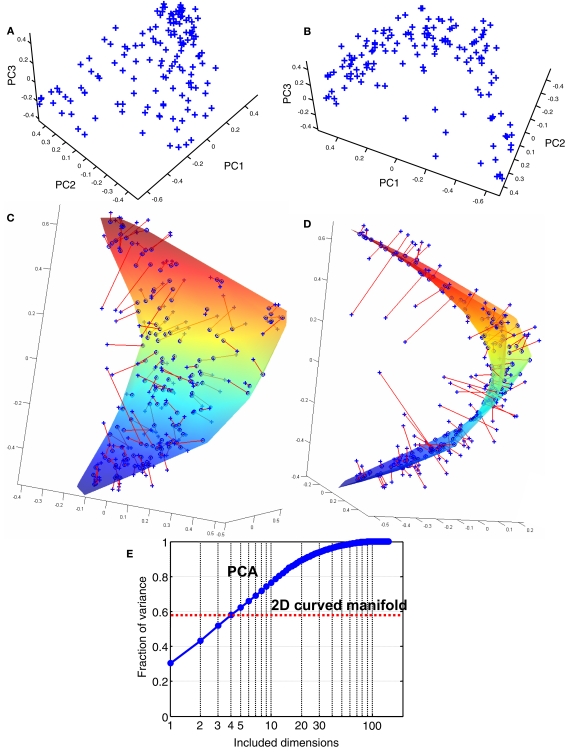
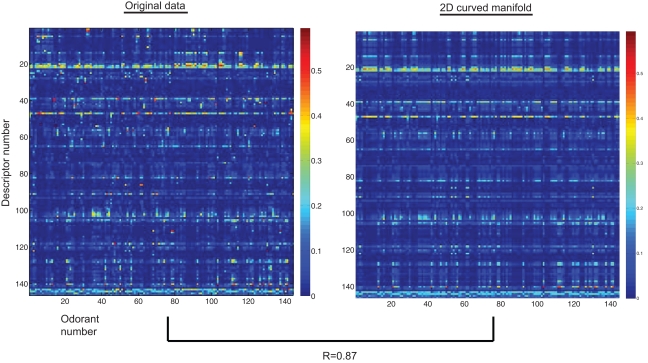
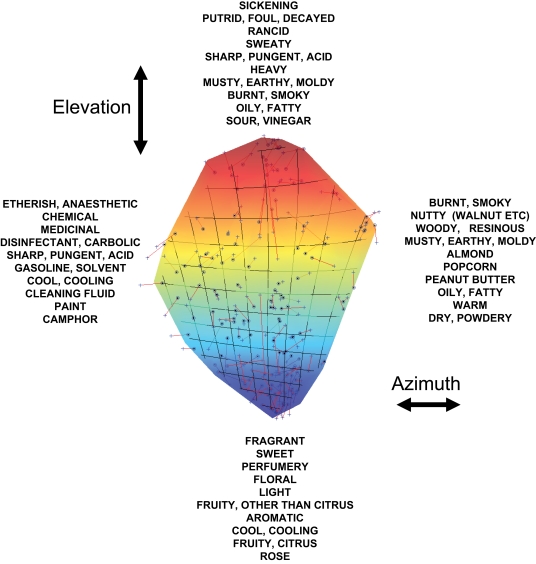
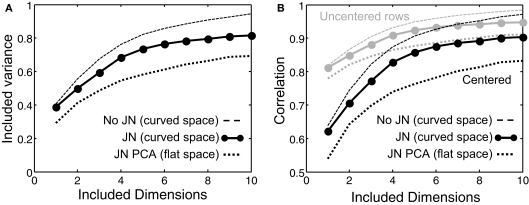
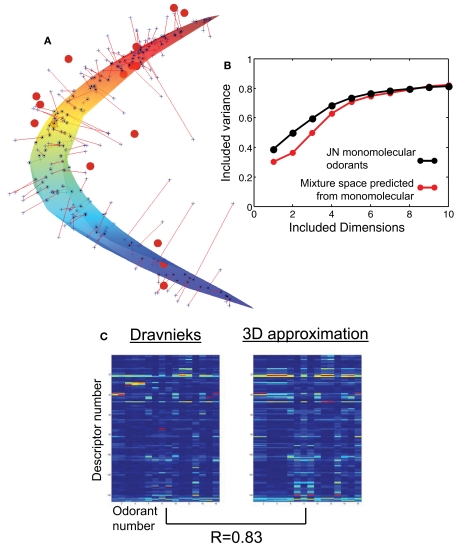
We analyze the responses of human observers to an ensemble of monomolecular odorants. Each odorant is characterized by a set of 146 perceptual descriptors obtained from a database of odor character profiles. Each odorant is therefore represented by a point in a highly multidimensional sensory space. In this work we study the arrangement of odorants in this perceptual space. We argue that odorants densely sample a two-dimensional curved surface embedded in the multidimensional sensory space. This surface can account for more than half of the variance of the perceptual data. We also show that only 12% of experimental variance cannot be explained by curved surfaces of substantially small dimensionality (<10). We suggest that these curved manifolds represent the relevant spaces sampled by the human olfactory system, thereby providing surrogates for olfactory sensory space. For the case of 2D approximation, we relate the two parameters on the curved surface to the physico-chemical parameters of odorant molecules. We show that one of the dimensions is related to eigenvalues of molecules' connectivity matrix, while the other is correlated with measures of molecules' polarity. We discuss the behavioral significance of these findings.

Keywords: olfaction; perception; profiling; sensory space.


Figures

Figure 1
Figure 1
Odorants in the PCA space. (A) Each of the 144 odorants can be represented as a point in the 146D space of perceptual descriptors. The odorants are shown by blue crosses placed in the 3D space of principal components. (B) When viewed from a certain direction, the odorants clustered near a C-shaped 1D curve, suggesting that in 3D the odorants are distributed close to a 2D curved surface. (C,D) The 2D surface representing the best fit to the data. The odorants (blue crosses) are connected to the nearest points on the surface by the red lines representing the residual errors. The 2D surface minimizes the total squared length of the residuals computed in 146D. The total squared length of residuals can be viewed as the remaining variance in the data not accounted for by the projection onto the 2D curved manifold. (E) The fraction of included variance as a function of the number of PCA dimensions. The fraction of variance accounted by the 2D curved manifold in (C) and (D) is 56% (red dotted line).
Figure 2
Figure 2
Comparison between original perceptual data and its their projection on to a 2D curved manifold. Images represent the coordinates (color coded) of 144 odorants in 146D space of descriptors for (A) the original data, (blue crosses in Figure 1 C,D) and (B) their projections onto a 2D curved manifold (circles in Figure 1 C,D).
Figure 3
Figure 3
The descriptors that contribute with large positive/negative coefficients to the coordinates on the 2D surface. The two coordinates are defined as elevation and azimuth as indicated.
Figure 4
Figure 4
Approximation of perceptual responses with spaces of small dimensionality. To avoid overfitting we applied the jackknife (JN) technique. Results for the best curved/flat spaces are shown by solid/dotted lines as a function of the number of dimensions included. The flat space technique is equivalent to PCA and is shown for comparison. (A) Variance of the dataset accounted for by the low-dimensional representation. The 2D curved manifold accounted for 51% of experimental variance. (B) Pearson correlation as a function of surface dimensionality.
Figure 5
Figure 5
Perceptual space of mixtures. (A) The percepts of 15 mixtures (red circles) placed in the 3D PCA space of monomolecular odorants. The 2D curved manifold of monomolecular odorants is also shown (colored surface). (B) Remaining variance after projection onto the curved space as a function of dimensionality of this space. Black/red lines show results for monomolecular odorants and mixtures respectively. The curved space was the same in both cases and was obtained by optimizing the surface for monomolecular odorants only. JN stands for jackknife analysis. The 2D curved space explains 51% of the variance in the monomolecular dataset. 3D surface explains about 50% of the variance for mixtures. Therefore the 3D space obtained from monomolecular smells is as predictive of mixture data as 2D space for monomolecular data. (C) The original mixture data (left, 146 descriptors, vertical axis, by 15 mixtures, horizontal axis) and the results after projecting onto 3D monomolecular space. The point-by-point Pearson correlation is about 0.83 indicating that 3D monomolecular curved space contains major information about the responses to mixtures.

References

    1. Belkin K., Martin R., Kemp S. E., Gilbert A. N. (1997). Auditory pitch as a perceptual analogue to odor quality. Psychol. Sci. 8, 340–34210.1111/j.1467-9280.1997.tb00450.x - DOI
    1. Berg M. D. (2008). Computational Geometry: Algorithms and Applications. 3rd Edn, Berlin: Springer xii, 386
    1. Berglund B., Berglund U., Engen T., Ekman G. (1973). Multidimensional analysis of twenty-one odors. Scand. J. Psychol. 14, 131–13710.1111/j.1467-9450.1973.tb00104.x - DOI - PubMed
    1. Bozza T., Vassalli A., Fuss S., Zhang J. J., Weiland B., Pacifico R., Feinstein P., Mombaerts P. (2009). Mapping of class I and class II odorant receptors to glomerular domains by two distinct types of olfactory sensory neurons in the mouse. Neuron 61, 220–23310.1016/j.neuron.2008.11.010 - DOI - PMC - PubMed
    1. Burden F. R. (1997). A chemically intuitive molecular index based on the eigenvalues of a modified adjacency matrix. Quan. Struct. Act. Relat. 16, 309–31410.1002/qsar.19970160406 - DOI

LinkOut - more resources