. 2011 Nov 15;83(22):8403-10.
doi: 10.1021/ac2017053. Epub 2011 Oct 27.

SILACtor: software to enable dynamic SILAC studies

Affiliations

SILACtor: software to enable dynamic SILAC studies

Michael R Hoopmann et al. Anal Chem. .

Abstract

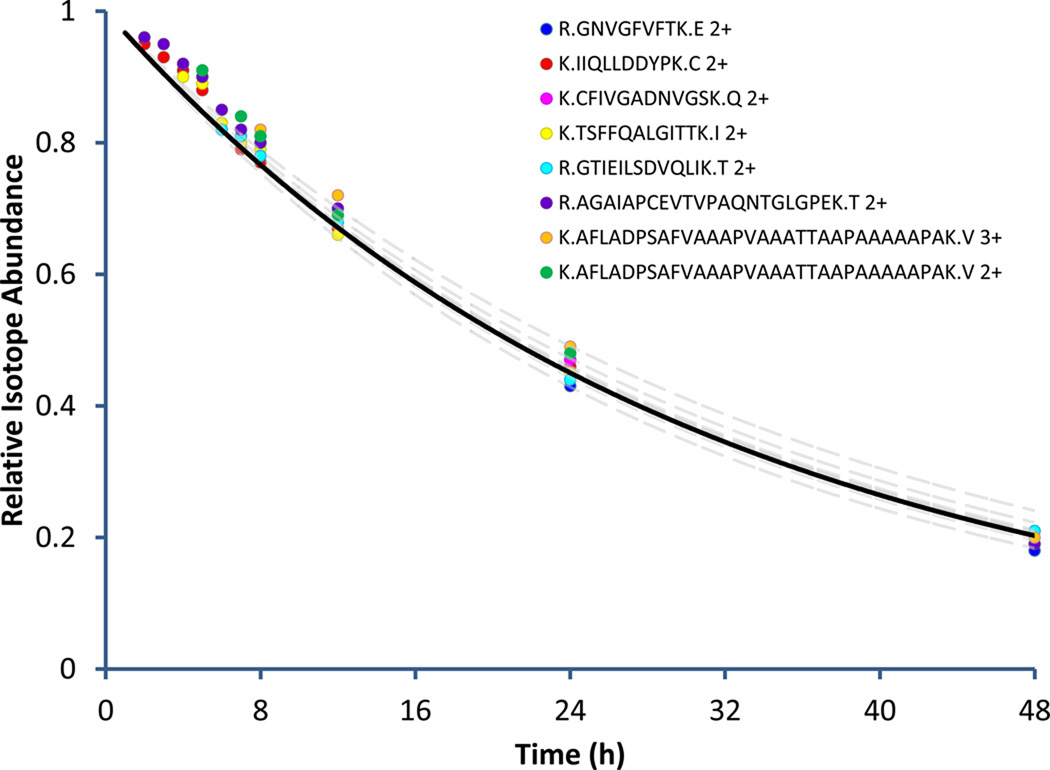
Stable isotope labeling by amino acids in cell culture (SILAC) is a versatile tool in proteomics that has been used to explore protein turnover on a large scale. However, these studies pose a significant undertaking that can be greatly simplified through the use of computational tools that automate the data analysis. While SILAC technology has enjoyed rapid adoption through the availability of several software tools, algorithms do not exist for the automated analysis of protein turnover data generated using SILAC technology. Presented here is a software tool, SILACtor, designed to trace and compare SILAC-labeled peptides across multiple time points. SILACtor is used to profile protein turnover rates for more than 500 HeLa cell proteins using a SILAC label-chase approach. Additionally, SILACtor contains a method for the automated generation of accurate mass and retention time inclusion lists that target peptides of interest showing fast or slow turnover rates relative to the other peptides observed in the samples. SILACtor enables improved protein turnover studies using SILAC technology and also provides a framework for features extensible to comparative SILAC analyses and targeted methods.


Figures

Figure 1
Figure 1
Schematic diagram of the steps incorporated in SILACtor analysis. SILAC datasets are first converted into a database of peptide sequences, accurate masses and retention times for all identified peptides. Technical replicates are analyzed, combined and an average RIA is calculated for each SILAC mass pair, identified or not. SILAC peptides with ratios that differ significantly from the mean for which previous MS/MS experiments were not performed are targeted for MS/MS analysis. All SILAC peptides that were identified to originate from a common protein are grouped and protein levels are calculated based on the average of all grouped peptides. Finally, light-labeled protein levels derived from multiple time points acquired after switching to heavy SILAC cell culture medium are used to determine loss of light-labeled proteins.
Figure 2
Figure 2
Example of fitting the exponential decay curve. At each time point, measurements in relative isotope abundance (RIA) for the peptides observed for a given protein are averaged together. The mean RIA values are used to fit an exponential decay curve to obtain a kloss coefficient for the protein.
Figure 3
Figure 3
Comparison of peptide and protein RIA calculations. The RIAs for individual peptides from the protein, RLA0, are plotted with dashed lines. The protein RIA is plotted as a solid line.
Figure 4
Figure 4
Example of targeted analysis using automatically generated mass and retention time inclusion lists. The peptide represented by peaks at 450.245 and 452.252 is of interest due to the unusually low RIA value when compared to the rest of the peptides in the sample. However, the peptide was not selected for MS/MS because of its low abundance relative to other more ions eluting at the same time. The mass and time inclusion list targets this specific peptide for MS/MS analysis and sequence identification is made.
Figure 5
Figure 5
Comparison of the RIAs of peptides identified at 24 hours using mass and retention time inclusion lists. The inclusion lists were used to target peptides without sequence identification that displayed RIAs that differed from the rest of the sample. The novel peptides identified using the mass and time lists (red bars) showed higher frequencies of low and high RIAs when compared to the shotgun acquired peptide sequences (blue bars).

References

    1. Ong SE, Blagoev B, Kratchmarova I, Kristensen DB, Steen H, Pandey A, Mann M. Mol Cell Proteomics. 2002;1:376–386. - PubMed
    1. Ong SE, Foster LJ, Mann M. Methods. 2003;29:124–130. - PubMed
    1. Cox J, Mann M. Nat Biotechnol. 2008;26:1367–1372. - PubMed
    1. Li XJ, Zhang H, Ranish JA, Aebersold R. Anal Chem. 2003;75:6648–6657. - PubMed
    1. Tsou CC, Tsui YH, Yian YH, Chen YJ, Yang HY, Yu CY, Lynn KS, Sung TY, Hsu WL. Nucleic Acids Res. 2009;37:W661–W669. - PMC - PubMed

Publication types