

Probabilistic sleep architecture models in patients with and without sleep apnea
- PMID: 21955148
- PMCID: PMC4487658
- DOI: 10.1111/j.1365-2869.2011.00937.x
Probabilistic sleep architecture models in patients with and without sleep apnea
Abstract
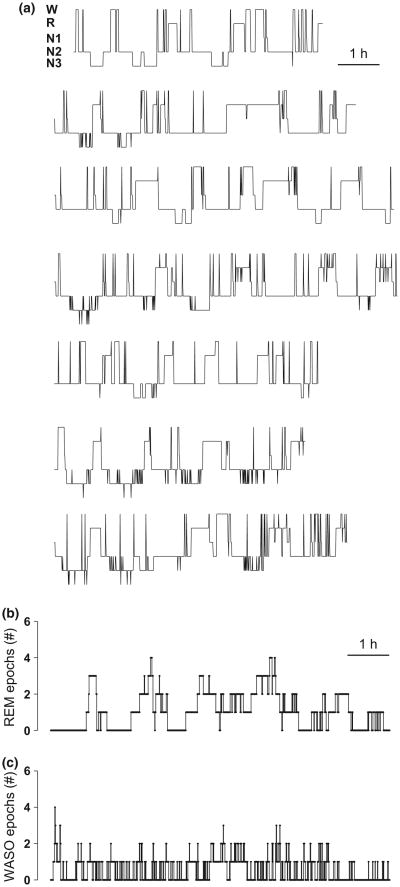
Sleep fragmentation of any cause is disruptive to the rejuvenating value of sleep. However, methods to quantify sleep architecture remain limited. We have previously shown that human sleep-wake stage distributions exhibit multi-exponential dynamics, which are fragmented by obstructive sleep apnea (OSA), suggesting that Markov models may be a useful method to quantify architecture in health and disease. Sleep stage data were obtained from two subsets of the Sleep Heart Health Study database: control subjects with no medications, no OSA, no medical co-morbidities and no sleepiness (n = 374); and subjects with severe OSA (n = 338). Sleep architecture was simplified into three stages: wake after sleep onset (WASO); non-rapid eye movement (NREM) sleep; and rapid eye movement (REM) sleep. The connectivity and transition rates among eight 'generator' states of a first-order continuous-time Markov model were inferred from the observed ('phenotypic') distributions: three exponentials each of NREM sleep and WASO; and two exponentials of REM sleep. Ultradian REM cycling was accomplished by imposing time-variation to REM state entry rates. Fragmentation in subjects with severe OSA involved faster transition probabilities as well as additional state transition paths within the model. The Markov models exhibit two important features of human sleep architecture: multi-exponential stage dynamics (accounting for observed bout distributions); and probabilistic transitions (an inherent source of variability). In addition, the model quantifies the fragmentation associated with severe OSA. Markov sleep models may prove important for quantifying sleep disruption to provide objective metrics to correlate with endpoints ranging from sleepiness to cardiovascular morbidity.
© 2011 European Sleep Research Society.
Conflict of interest statement
Figures


Similar articles
-
Obstructive sleep apnea alters sleep stage transition dynamics.PLoS One. 2010 Jun 28;5(6):e11356. doi: 10.1371/journal.pone.0011356. PLoS One. 2010. PMID: 20596541 Free PMC article.
-
Analysing the impact of body position shift on sleep architecture and stage transition: A comprehensive multidimensional study using event-synchronised polysomnography data.J Sleep Res. 2024 Aug;33(4):e14115. doi: 10.1111/jsr.14115. Epub 2023 Dec 11. J Sleep Res. 2024. PMID: 38083980
-
Nocturnal autonomic function in preschool children with sleep-disordered breathing.Sleep Med. 2013 Dec;14(12):1310-6. doi: 10.1016/j.sleep.2013.07.010. Epub 2013 Sep 3. Sleep Med. 2013. PMID: 24091143
-
Characterizing sleep structure using the hypnogram.J Clin Sleep Med. 2008 Aug 15;4(4):349-55. J Clin Sleep Med. 2008. PMID: 18763427 Free PMC article.
-
The sleep supine position has a major effect on optimal nasal continuous positive airway pressure : relationship with rapid eye movements and non-rapid eye movements sleep, body mass index, respiratory disturbance index, and age.Chest. 1999 Oct;116(4):1000-6. doi: 10.1378/chest.116.4.1000. Chest. 1999. PMID: 10531165
Cited by
-
Quantifying sleep architecture dynamics and individual differences using big data and Bayesian networks.PLoS One. 2018 Apr 11;13(4):e0194604. doi: 10.1371/journal.pone.0194604. eCollection 2018. PLoS One. 2018. PMID: 29641599 Free PMC article.
-
A Focal Inactivation and Computational Study of Ventrolateral Periaqueductal Gray and Deep Mesencephalic Reticular Nucleus Involvement in Sleep State Switching and Bistability.eNeuro. 2020 Oct 14;7(6):ENEURO.0451-19.2020. doi: 10.1523/ENEURO.0451-19.2020. Print 2020 Nov-Dec. eNeuro. 2020. PMID: 33055199 Free PMC article.
-
Addressing sleep disturbances: an opportunity to prevent cardiometabolic disease?Int Rev Psychiatry. 2014 Apr;26(2):155-76. doi: 10.3109/09540261.2014.911148. Int Rev Psychiatry. 2014. PMID: 24892892 Free PMC article. Review.
-
Covert sleep-related biological processes are revealed by probabilistic analysis in Drosophila.Proc Natl Acad Sci U S A. 2020 May 5;117(18):10024-10034. doi: 10.1073/pnas.1917573117. Epub 2020 Apr 17. Proc Natl Acad Sci U S A. 2020. PMID: 32303656 Free PMC article.
-
Sleep architecture and obstructive sleep apnea in obese children with and without metabolic syndrome: a case control study.Sleep Breath. 2016 May;20(2):845-51. doi: 10.1007/s11325-015-1291-y. Epub 2015 Dec 28. Sleep Breath. 2016. PMID: 26711131
References
-
- Ancoli-Israel S, Cole R, Alessi C, Chambers M, Moorcroft W, Pollak CP. The role of actigraphy in the study of sleep and circadian rhythms. Sleep. 2003;26:342–392. - PubMed
-
- Chervin RD, Aldrich MS. The Epworth Sleepiness Scale may not reflect objective measures of sleepiness or sleep apnea. Neurology. 1999;52:125–131. - PubMed
Publication types
MeSH terms
Grants and funding
LinkOut - more resources
Full Text Sources
Medical
